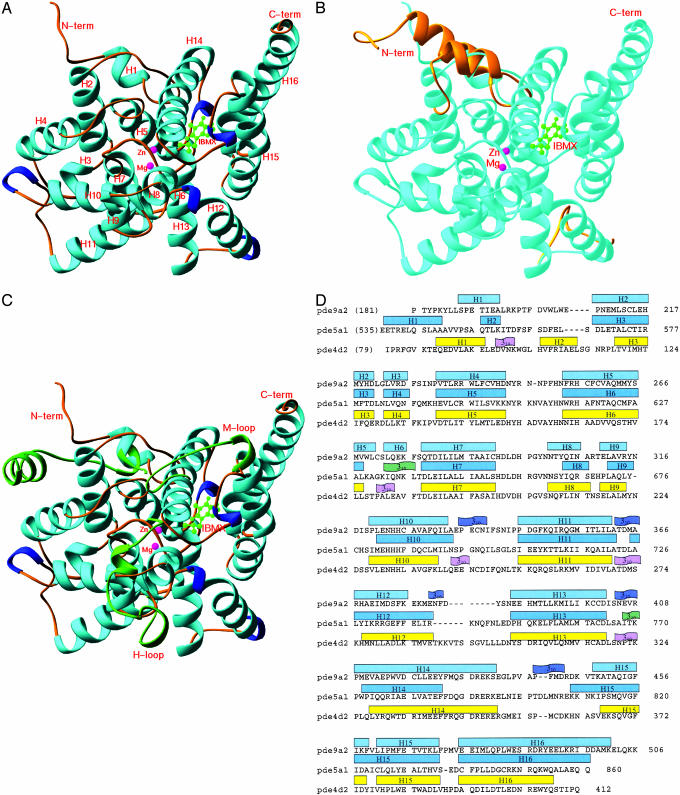
Fig. 1.
Structures of the PDE–IBMX complexes. (A) Ribbon diagram of the catalytic domain of PDE9A2–IBMX. All the ribbon pictures in Figs. 1, 2, 3 are drawn by ribbons (34). The α-helices are cyan, the 310-helices are blue, the metal ions are pink, and IBMX is green. (B) Superposition of the N-terminal residues 79–119 and loop 287–300 of PDE4D2 (golden) over PDE9A2 (light cyan). The remaining structures of PDE4D2 are very similar to PDE9A2 and are not shown. (C) Superposition of three regions of PDE5A1 (green) over PDE9A2 (light cyan). These regions include the N-terminal residues 535–565 and H and M loops (residues 661–676 and 787–812). The remaining regions of PDE5A1 are similar to PDE9A2 and are not shown. (D) Sequence and secondary structures of the PDE catalytic domains.

