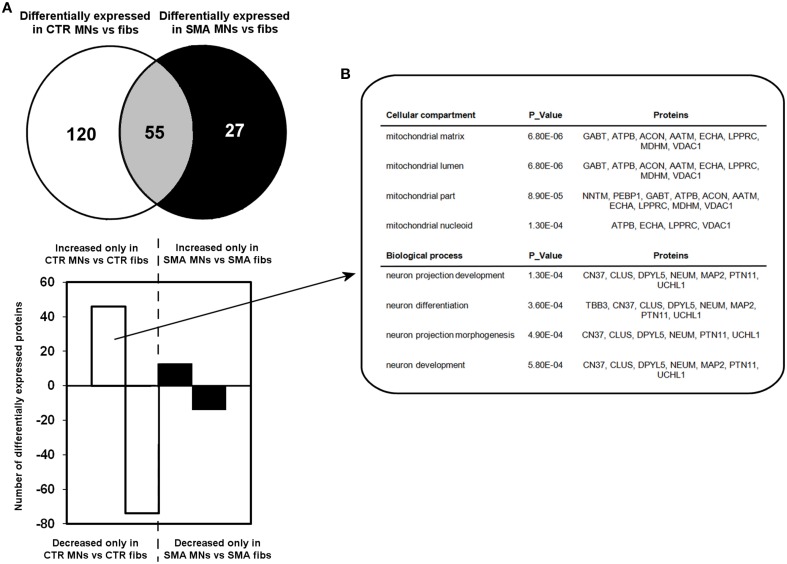
Figure 3.
Perturbation of developmental and differentiation pathways in SMA motor neurons. (A) A Venn diagram and bar chart illustrates the number of differentially expressed proteins seen in control motor neurons (n = 1) compared to control fibroblasts (n = 1) (blue circle and blue bars) and SMN motor neurons (n = 1) compared SMA fibroblasts (n = 1) (green circle and green bars). (B) Bioinformatics analysis of the 46 proteins that were only increased in the control motor neurons vs. control fibs was conducted using the Database for Annotation, Visualization and Integrated Discovery (DAVID). CTR, control; MNs, motor neurons.

