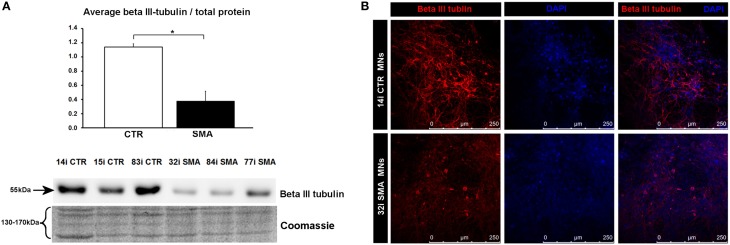
Figure 4.
Reduction of beta III-tubulin levels in SMA motor neurons. (A) Representative western blot showing beta III-tubulin protein levels in three different control and SMA motor neuron cell lines, along with Coomassie stained gel as loading control. The graph above it illustrates the average integrated density of the beta III-tubulin bands from this blot/total protein (Coomassie gel), as determined by ImageJ software. Error bars represent standard error from the mean and statistical significance was calculated using an unpaired, ced t-test with two-sample unequal variance. Please note that the Coomassie loading control shown here is the same that is shown for Figure 1D because they were both derived from the same blot. (B) Representative confocal images indicate a reduction of beta III-tubulin levels in SMI-32 positive 32i SMA motor neurons. CTR, control; MNs, motor neurons. *p ≤ 0.05.

