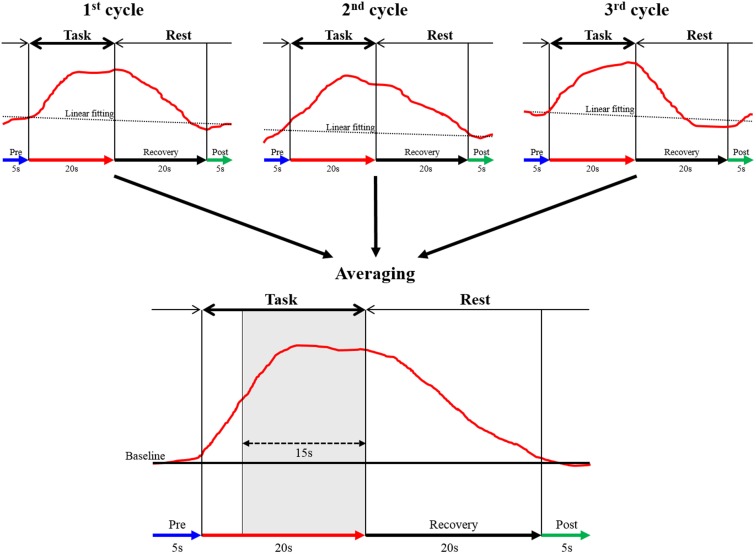
Figure 3.
The data analysis using integral mode. The red curve represents the sham NIRS waveform in one case. This waveform was created by averaging the data measured over 3 cycles in a block design. Linear fitting was applied to the data between pre-task (blue arrow) and post-task (green arrow) periods. The thick black arrow above the red curve indicates the task period, and the thin arrow shows the rest period. The vertical axis represents oxy-Hb concentration (mMmm), and the horizontal axis represents the time course of 1 cycle. The mean value of oxy-Hb measured between 5 and 20 s during the task (15 s, shaded gray area in averaged graph) was calculated.

