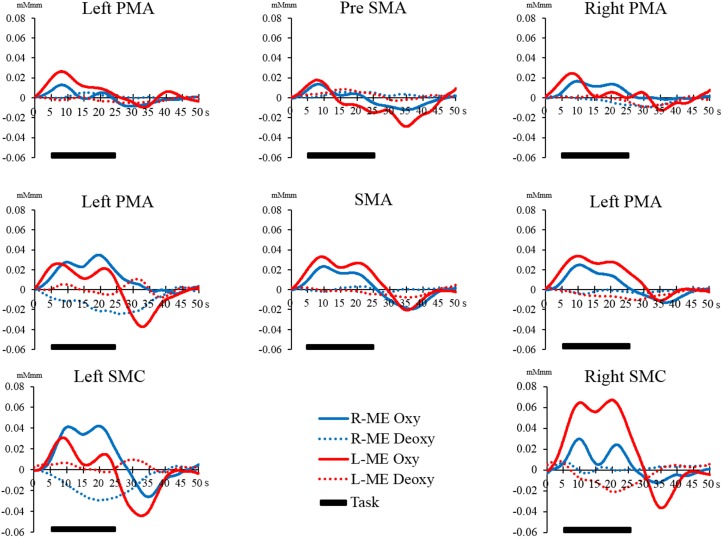
Figure 7.
Time course of changes in oxy-Hb and deoxy-Hb concentration during the ME task in each brain region. The horizontal axis represents time course. The vertical axis represents changes in oxy-Hb and deoxy-Hb concentration. The solid line (left hand, red; right hand, blue) shows the oxy-Hb signal change. The dotted line shows the deoxy-Hb signal change. The horizontal bar represents the period during the task. The time course was averaged across all participants.

