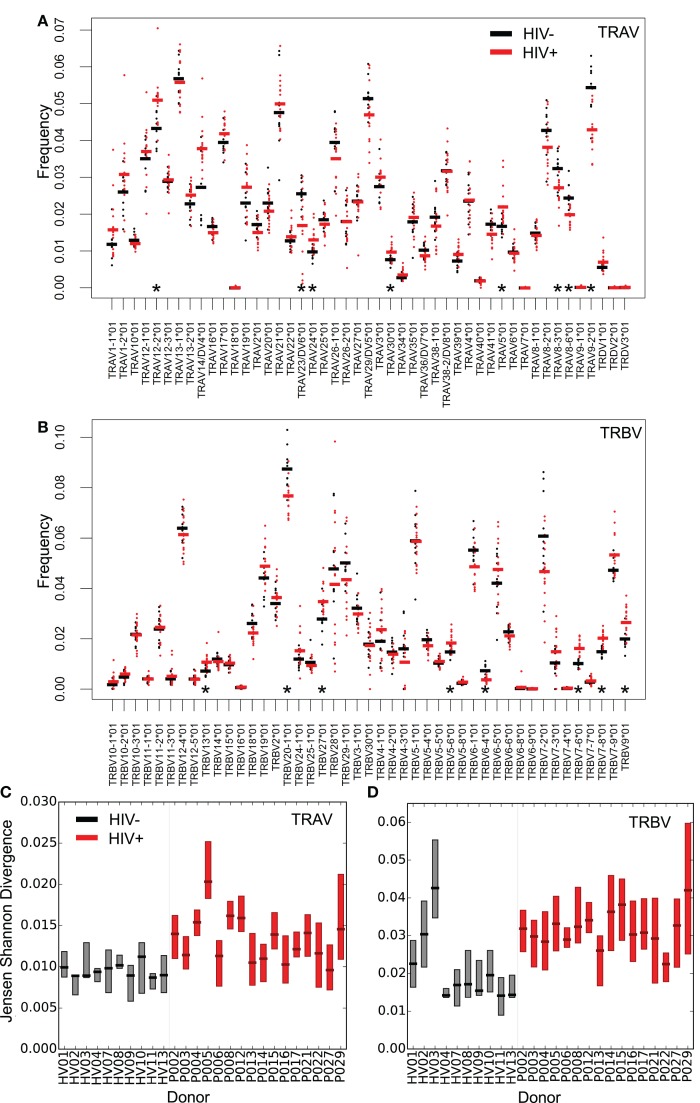
Figure 2.
Altered distribution and interindividual differences in V gene usage in the repertoires of HIV+ individuals. The frequency of V alpha (A) and V beta (B) gene usage for the unique TCR repertoires of each donor sample within the two groups (HIV− in black or untreated HIV+ in red). Bars show the mean proportion for each V gene in each group. Asterisks (*) show those V genes, which differ significantly in their usage (T test, p < 0.05) between HIV− and HIV+. Interindividual differences in patterns of V gene usage (measured using Jensen–Shannon distances) for alpha (C) and beta (D) V genes. The plot shows the median and interquartile range of the Jensen–Shannon distances between each individual and all other individuals in turn from the same group. HIV− are shown in black; HIV+ are shown in red.

