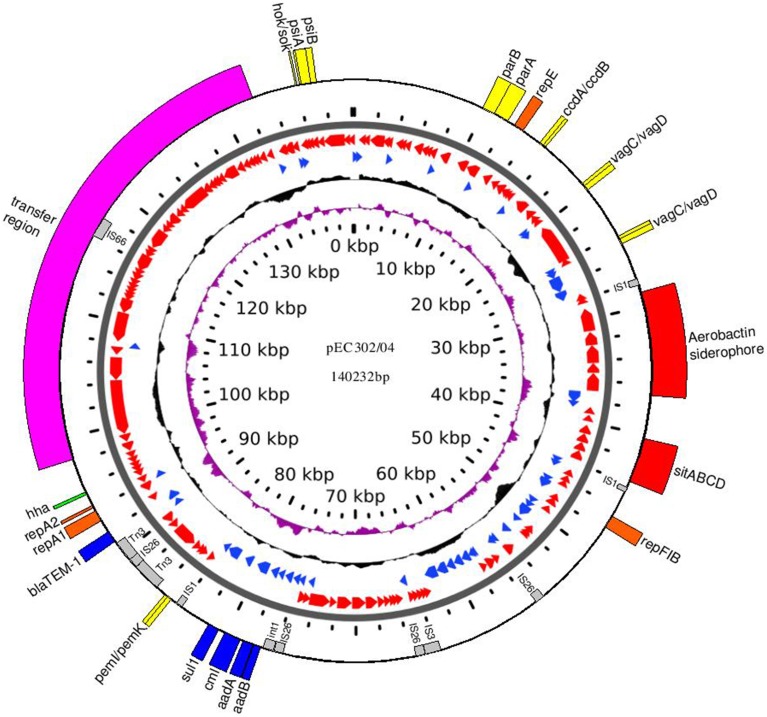
Figure 1.
Circular map of plasmid pEC302/04. The 1st (innermost ring) and the 6th rings show the plasmid size in kbp. The 2nd and 3rd rings (from inner to outer) show the GC skew (purple) and GC content (black), respectively. The 4th and 5th rings show the ORFs in forward (blue) and reverse orientation (red). The outermost ring shows the important genes encoding regions highlighting with different colors according to its function: orange, replication; pink, transfer region; yellow, addictive systems; red, iron acquisition systems; blue, antimicrobial resistance; green, other virulence factor; gray, IS elements.

