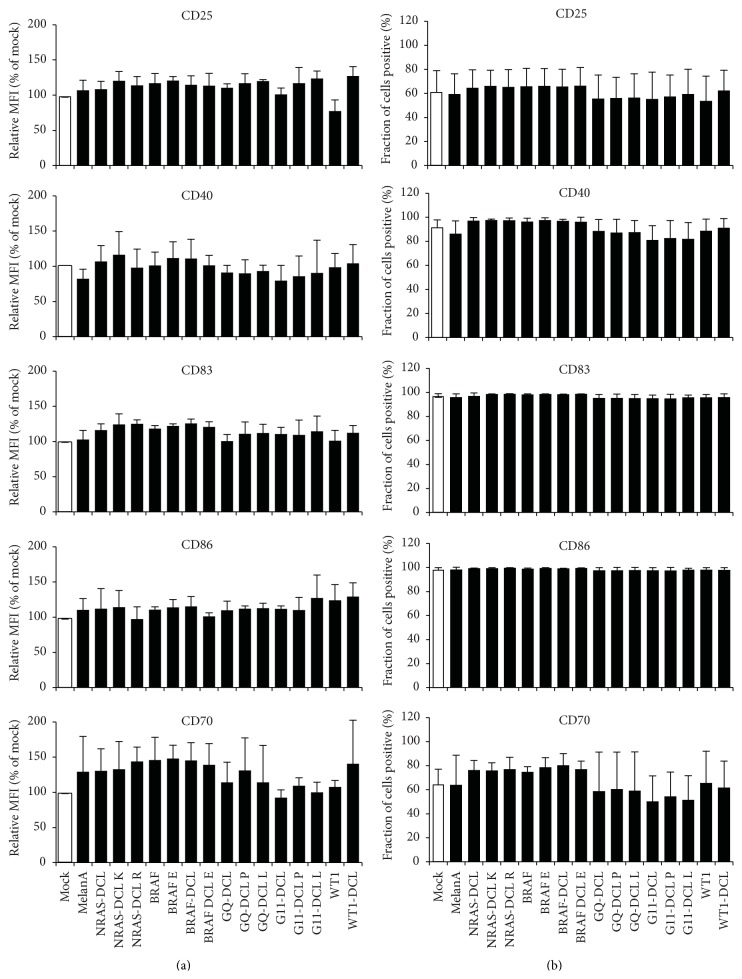
Figure 2.
No difference in phenotype between mock- and mRNA-electroporated DCs. DCs were either electroporated without RNA (Mock) or a panel of 16 RNAs encoding different tumor antigens, either mutated or not and either linked to the lysosomal targeting signal DC-LAMP or not (see Table 1). Twenty-four hours after electroporation, the surface expression of CD25, CD40, CD86, CD70, and CD83 was determined by flow cytometry. Surface marker expression of mock-electroporated DCs was put at 100% and marker expression after electroporation of the mRNAs was put in relation to that (a), or percent positive cells are shown (b). Shown are averages of at least 3 independent experiments. Error bars indicate the standard deviation (SD). According to a 1-way ANOVA with multiple comparison test, no statistically significant differences were present within the surface staining data (p > 0.05).

