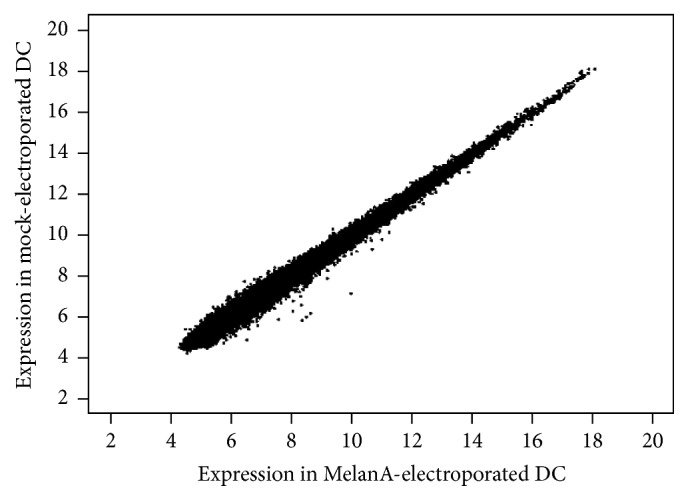
Figure 5.

No difference in microarray analysis between mock- and MelanA-RNA-electroporated DCs. Scatter plot of the probe set expression levels for MelanA-RNA-electroporated DCs versus Mock-electroporated DCs samples. Data from 6 samples per experimental condition were processed for background correction and normalization. In the figure, the average probe intensity for each experimental condition is visualized.
