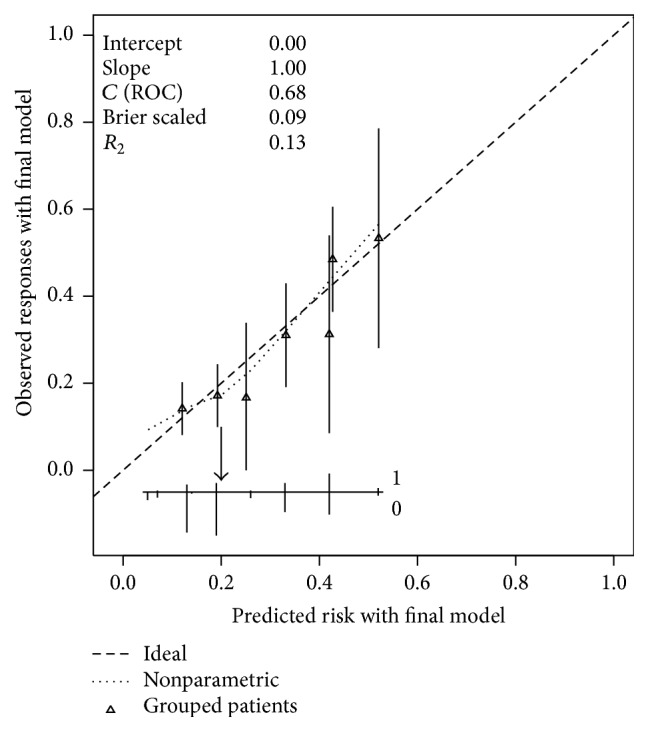
Figure 2.

Calibration of the nomogram for AML prediction. The horizontal axis contains the predicted probability of AML; the vertical axis described the observed probability of AML. Perfect prediction corresponds to the dashed oblique line (45°). Bars correspond to CI of estimated grouped proportions and the arrow corresponds to the cut-off of 20% risk of AML.
