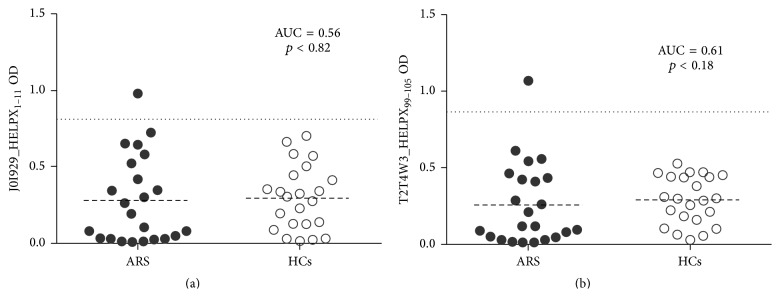
Figure 4.
Distribution of anti-HP Abs levels measured by ELISA in T1D at-risk subjects and healthy controls. Sera of 23 ARS and 22 HCs were screened for Abs against J0I929_HELPX1–11 (a) and T2T4W3_HELPX99–105 (b). The dotted lines represent cut-off values calculated by ROC analysis and used to discriminate between positive and negative samples. Dashed lines indicate the respective mean OD values. Area under the curve (AUC) and p values are reported in the top-right corners.

