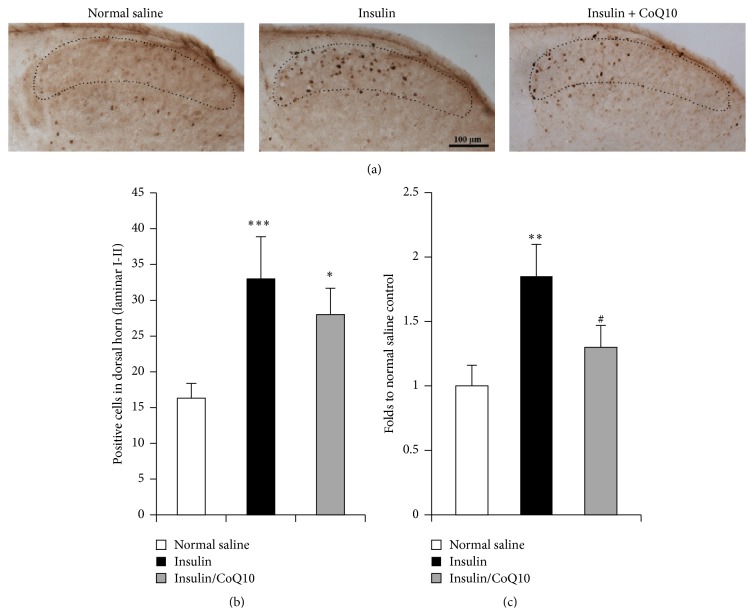
Figure 4.
Immunohistology of c-Fos on lumber spinal cord and RT-PCR of c-Fos mRNA. (a) shows the expression of c-Fos in the dorsal horn of spinal cord of normal saline-injected mice, insulin-induced hypoglycemic mice, and insulin-induced hypoglycemic mice pretreated with CoQ10. (b) shows the results of image quantification in laminar I-II of the dorsal horn (dotted line area). (c) shows the result of quantification of RT-PCR of c-Fos mRNA. ∗∗∗ p < 0.001, ∗∗ p < 0.01, and ∗ p < 0.05 compared to normal saline controls; # p < 0.05, CoQ10 treated group compared to insulin group (Student's t-test).

