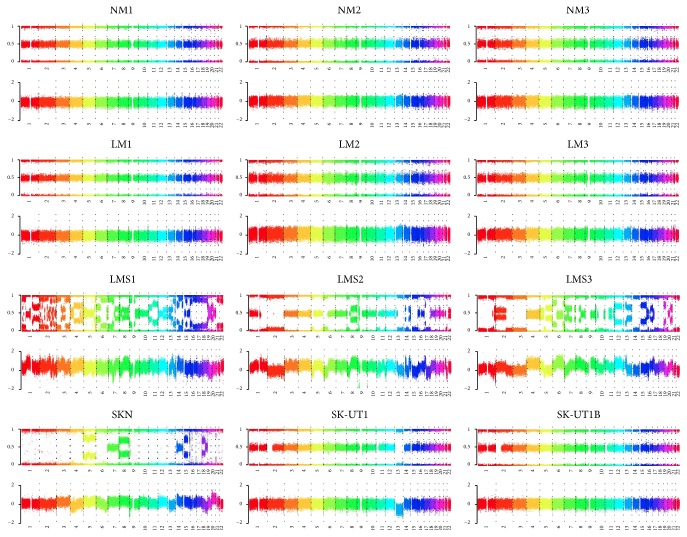
Figure 1.
Chromosomal constitutions of normal metrium tissues (NM), leiomyoma (LM), and leiomyosarcoma (LMS) cases, and LMS-derived cell lines determined by SNP-array analysis. BAF (upper) and LRR (lower) are shown for 22 autosomal chromosomes of each of the 12 samples. The data ranges shown are 0 to 1 for BAF and −2 to 2 for LRR.

