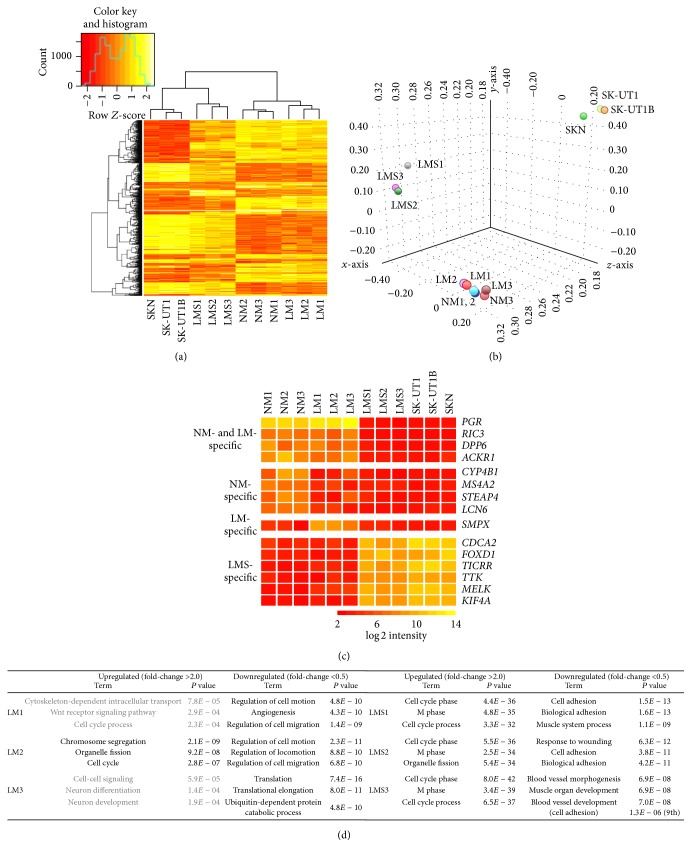
Figure 3.
Transcriptome analysis for NM, LM, LMS, and LMS-derived cell lines. (a) Hierarchical clustering analysis for the normalized log2-transformed intensities of the 1,036 differentially expressed genes using Heatmap2. (b) Three-dimensional visualization of PCA for the entire probe set. (c) Candidate expression markers. Of the 45 LMS-specific genes selected, only six, whose log2 intensities in LMS and LMS-derived cell lines are >9, are shown (full genes are shown in Supplementary Material, Table S3). (d) GO analysis for up- and downregulated genes in each of the LM and LMS samples. The top three GO terms of biological process and their P values are shown in black when the corresponding Benjamini's corrected P value was <0.05 or are otherwise shown in grey.

