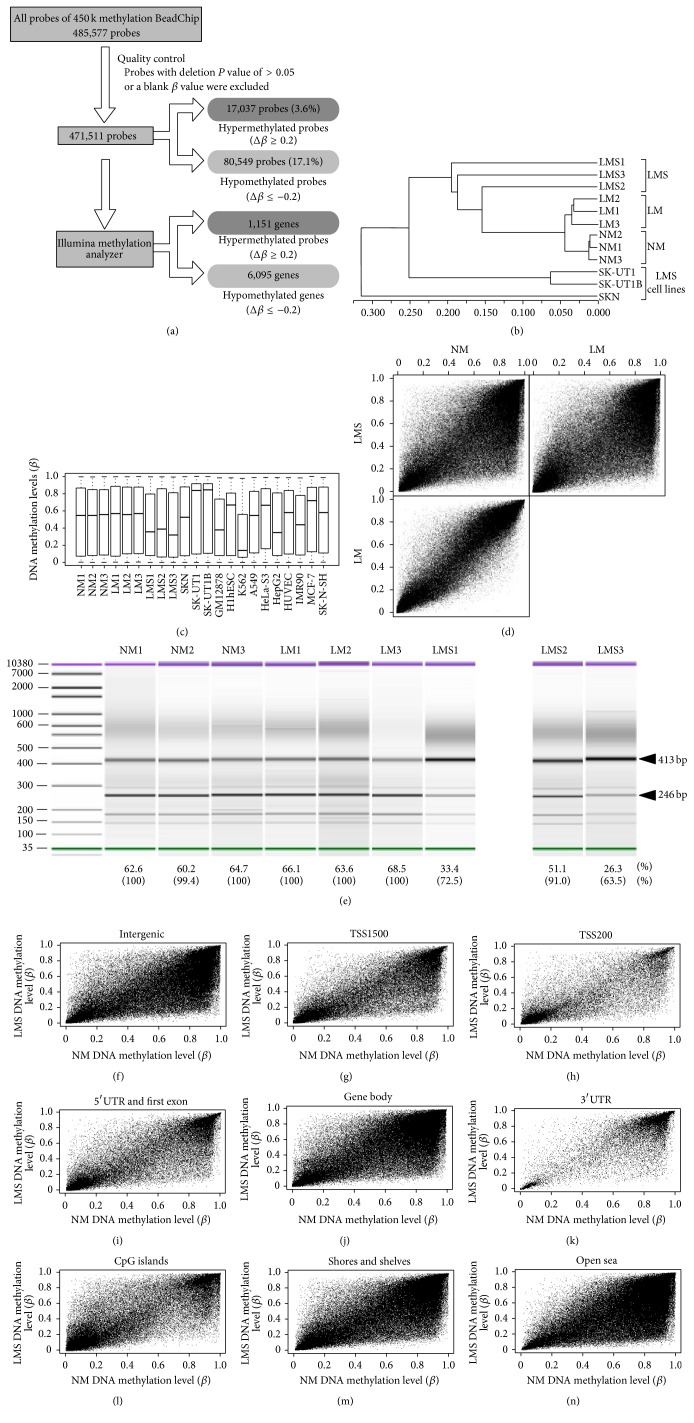
Figure 4.
Comparisons and characterization of DNA methylation profiles of NM, LM, LMS, and LMS cell lines. (a) Flow chart showing results of quality control procedures and the extraction of differentially methylated probes and genomic regions. (b) Hierarchical clustering of 12 samples using β values of 471,511 probes that passed the data QC procedures (see (a)). (c) Boxplots of β values for the 471,511 probes that passed QC procedures for 12 samples analyzed in this study, as well as boxplots of the entire β values of HumanMethylation450 BeadChip data for ten cell lines obtained from the ENCODE DNA Methylation Track (http://hgdownload.cse.ucsc.edu/goldenPath/hg19/encodeDCC/wgEncodeHaibMethyl450/). Whereas LMS tissues exhibited global hypomethylation tendencies, LMS-derived cell lines did not. To assess whether observed global methylation levels (normal or hyper) are specific to LMS-derived cell lines, we examined those of six cancer cell lines (K562, A549, HeLa-S3, HepG2, MCF-7, and SK-N-SH) and confirmed their highly various levels. The DNA methylation profiles of these cancer cell lines as well as LMS-derived cell lines are likely extensively deviated from those of their origin (a cancerous tissue). (d) Scatter (x-y) plots showing the average β values of each sample for the 471,511 probes (NM versus LM, NM versus LMS, and LM versus LMS). (e) COBRA assays for LINE1 methylation. 413-bp and 246-bp bands represent uncut (unmethylated) and cut (methylated) bands upon HinfI digestion, respectively. The methylation index (%) was calculated as (the intensity of the cut band/246)/((the intensity of the cut band/246) + (the intensity of the uncut band/413)) and shown at the bottom. The measured methylation index was corrected using the standard curve (Supplementary Material, Figure S2) obtained with the methylated and unmethylated control bisulfite-converted DNAs (EpiTect PCR Control DNA Set #59695, Qiagen). The corrected methylation levels (%) are shown in parentheses. Though the LINE1 methylation levels of LM were similar to those of NM, LMS samples showed lower levels of LINE1 methylation. (f)–(k) Scatter plots of β values (LMS average (y-axis) versus NM average (x-axis)) in the six gene feature groups. (l)–(n) Scatter plots of β values (LMS average (y-axis) versus NM average (x-axis)) of three subgroups in relation to CpG islands (CGIs): CGIs (l), CGI shores and shelves (within 4 kb distance from a CGI) (m), and non-CGI regions (over 4 kb distance from a CGI, open sea) (n). CpG sites within CGIs, the majority of which are unmethylated, were found to be more frequently hypermethylated (4.5%) than those outside of CGIs (2.5% in open sea) and to be much less frequently hypomethylated (4.6%) than those outside of CGIs (16.7% in shores and shelves, and 28.1% in open sea) (Table 2).

