Figure 5.
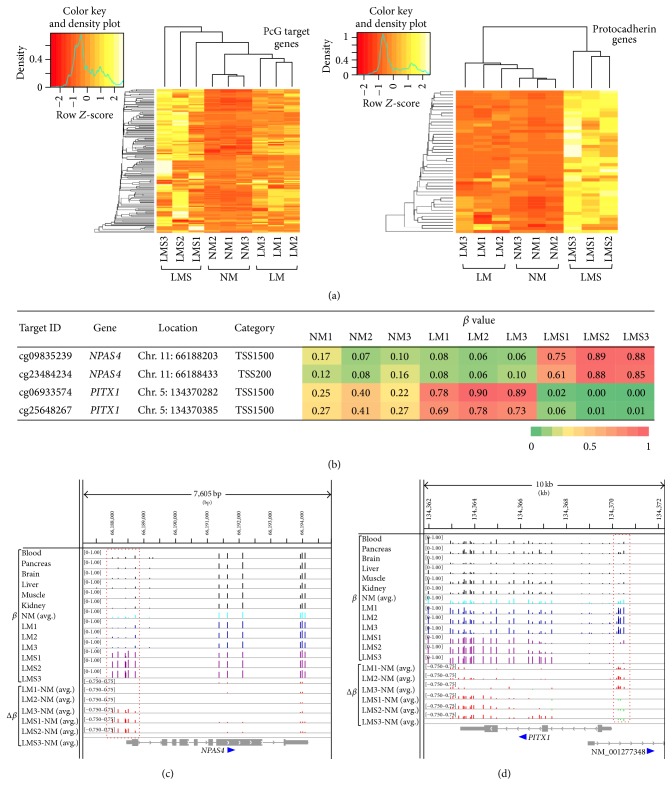
Candidate methylation markers to distinguish LM and LMS. (a) Clustering analyses of TSS200 probes at 37 PcG target gene loci (left) and 15 protocadherin gene loci (right) hypermethylated (Δβ > 0.2) in LMS compared to NM. The standard deviations of β values of 133 CpG probes (at 37 PcG target loci) ranged from 0.01 to 0.38 (median 0.22). The standard deviations of β values of 47 CpG probes (at 15 protocadherin genes) ranged from 0.06 to 0.31 (median 0.22). β values and Z-scores of those 133 and 47 CpG probes in NM, LM, and LMS samples are shown in Supplementary Material, Table S7. (b) Four selected promoter CpG sites whose methylation levels were strikingly different between LMS and LM. (c) and (d) DNA methylation profiles at NPAS4 and PITX1 loci. Methylation β values (data range: 0 to 1) and Δβ values (data range: −0.75 to 0.75) are shown as vertical bars using the Integrative Genomics Viewer. The colors of vertical bars for β values are as follows: black for six normal tissues (blood, pancreas, brain, liver, muscle, and kidney), light blue for the average of three NM samples (“NM(avg.)”), blue for LM samples, and purple for LMS samples. Positive and negative Δβ values for each of the LM and LMS samples (compared to NM(avg.)) are indicated by red and green vertical bars, respectively. The promoter region containing the probes shown in (b) is boxed by red dashed lines. Exon-intron structure and transcriptional orientation of the gene(s) are shown at the bottom.

