Figure 2.
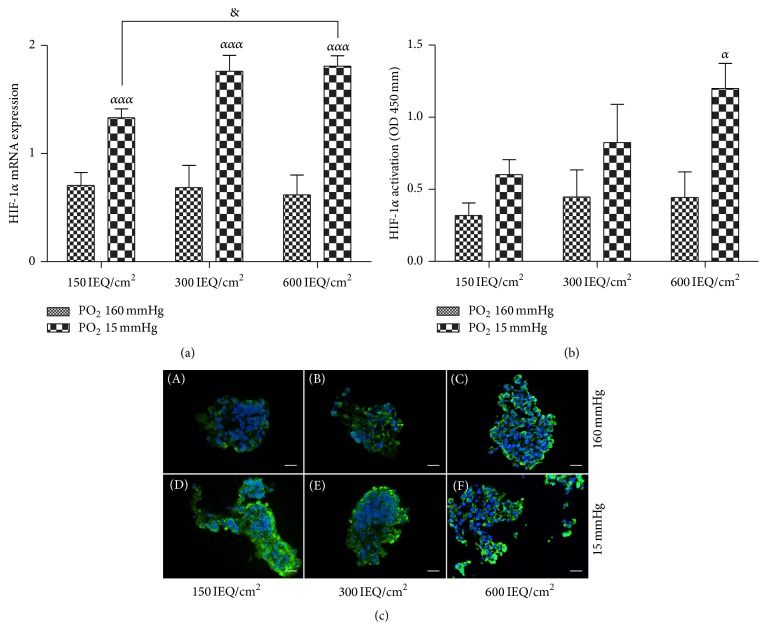
Hypoxia marker expression. (a) Levels of hypoxia-inducible factor 1 alpha (HIF-1α) mRNA expression after 24 hours in culture under normoxia (PO2 160 mmHg) and hypoxia (PO2 15 mmHg) at 150, 300, and 600 IEQ/cm2. (b) Translocation and activation of HIF-1α protein were performed after 24 hours in each density (150, 300, and 600 IEQ/cm2) under normoxia and hypoxia conditions. (c) Representative images of hypoxyprobe stained cells at 150, 300, and 600 IEQ/cm2 under normoxia and hypoxia. Blue staining highlights the cell nuclei (DAPI), and the green staining indicates pimonidazole (hypoxia marker) expression. Scale bars = 50 μm. ααα p < 0.001 compared to the same concentration under normoxic conditions, & p < 0.05 compared to 150 IEQ/cm2 under hypoxic conditions, and α p < 0.05 compared to the control.

