Figure 3.

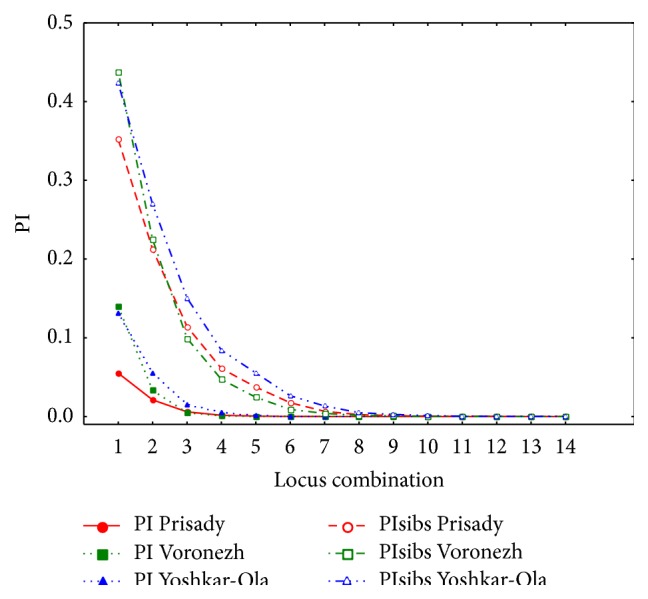
Relationship of PI and PIsibs from the number of used loci. 1 represents locus 1, 2 represents loci 1 + 2, and so forth.

Relationship of PI and PIsibs from the number of used loci. 1 represents locus 1, 2 represents loci 1 + 2, and so forth.