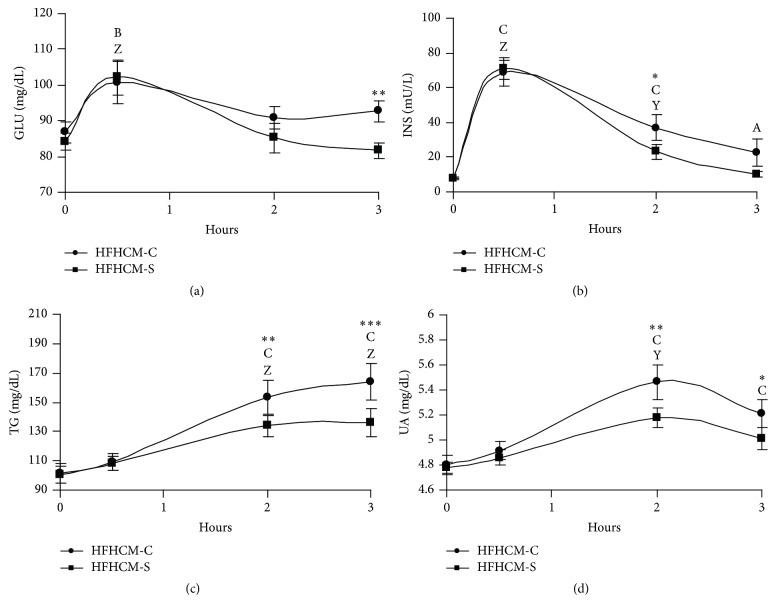
Figure 2.
Line plots showing the serum levels as means ± standard errors (n = 10) in plasma glucose (GLU, (a)), insulin (INS, (b)), triglycerides (TG, (c)), and uric acid (UA, (d)), following high fat and carbohydrates meal ingestion with control (HFHCM-C) or Snello (HFHCM-S) cookies. Two-Way Repeated Measures ANOVA followed by Student-Newman-Keuls post hoc analysis. A: p < 0.05; B: p < 0.01; C: p < 0.001, single time point versus before meal intake within HFHCM-C; Y: p < 0.01; Z: p < 0.001, single time point versus before meal intake within HFHCM-S; ∗ p < 0.05; ∗∗ p < 0.01; ∗∗∗ p < 0.001, HFHCM-S versus HFHCM-C within time.

