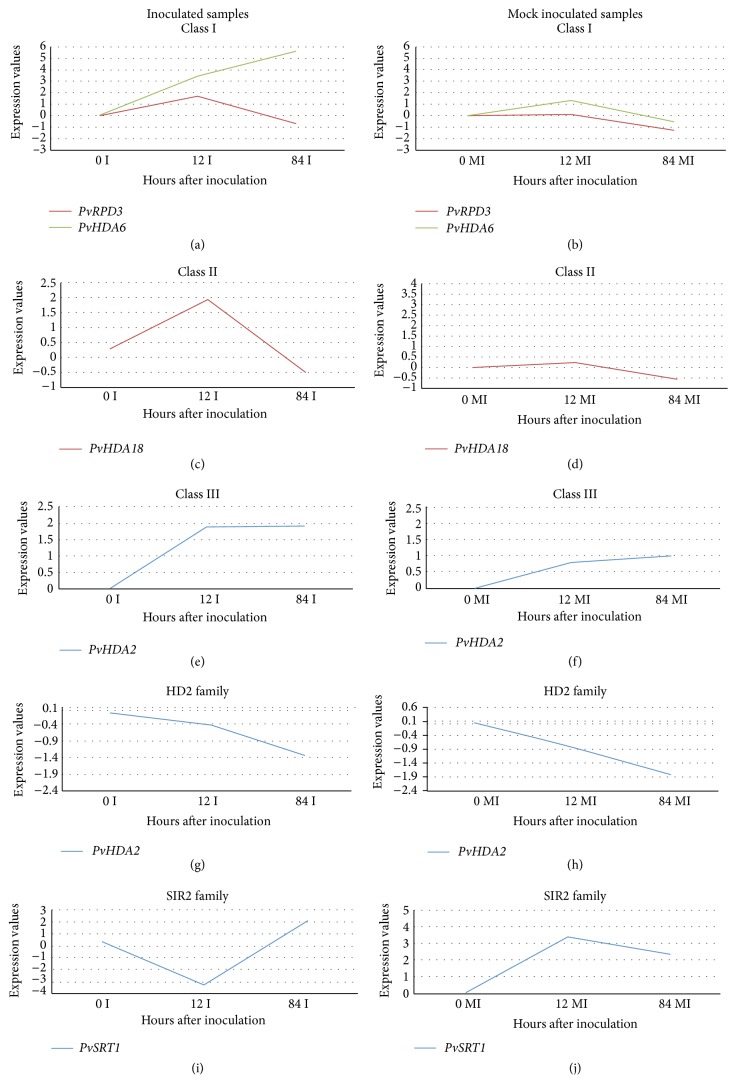
Figure 5.
qRT-PCR analysis of HDAC genes. Figures on the left-hand side are from inoculated samples, while figures on the right-hand side are from mock inoculated samples. Sampling time points are shown in x-axis and ΔΔCT values are shown in y-axis. Sierra 0 hai mock inoculated samples and the endogenous gene TC362 were used for calculating expression values.

