Figure 5.
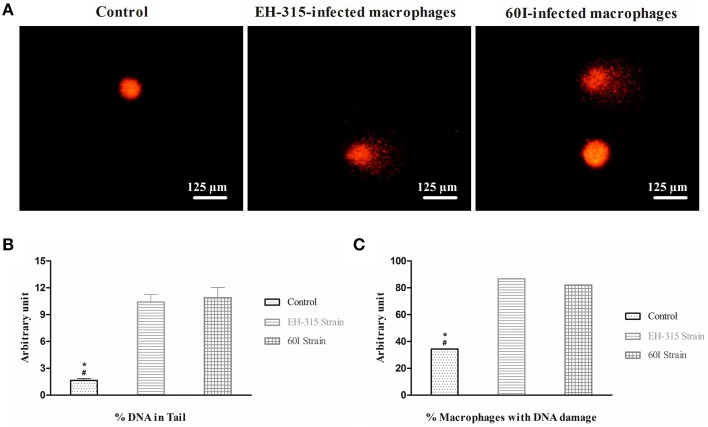
Comet assay data of AMJ2-C11 macrophages infected with H. capsulatum yeasts. (A) Images were acquired using a fluorescence microscope equipped with a 515–560 nm excitation filter and a 590 nm barrier filter. (B) Evaluation of nuclear fragmentation in AMJ2-C11 macrophages infected with H. capsulatum. Control (non-infected macrophages). Values are representative of the percentage of fragmented DNA present in the comet's tail. (C) Percentage of macrophage population showing DNA damage in infected and non-infected (control) cells. Scores given are the mean ± SD. Data were analyzed by Kruskal-Wallis test with Dunn's post-test. *P < 0.05 when control vs. strain EH-315 was compared; #P < 0.05 when control vs. strain 60I was compared.

