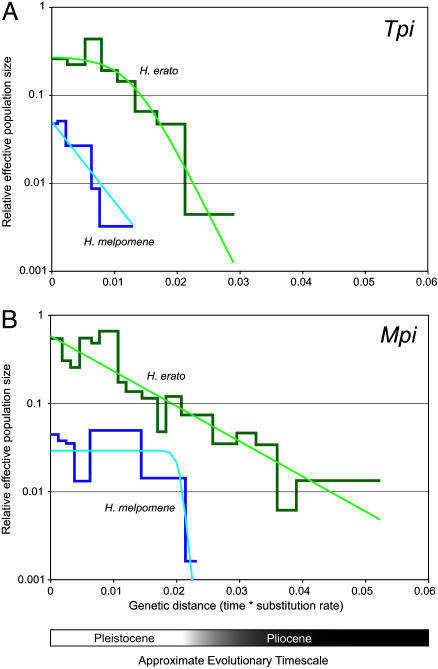
Fig. 2.
Estimated demographic histories of the H. erato and H. melpomene radiations, for Tpi (A) and Mpi (B). The thicker, piecewise plots are the generalized skyline plots. The approximate timescale assumes an evolutionary rate of ≈1.1–1.2% per lineage per 1 million years (1). Thus, the approximate Pleistocene–Pliocene boundary corresponds to a genetic distance of ≈0.023 substitutions per site. The thinner, smooth curves represent the parametric ML demographic history (see Table 2). Plots for H. erato (green) and H. melpomene (blue) are shown on the same graph.

