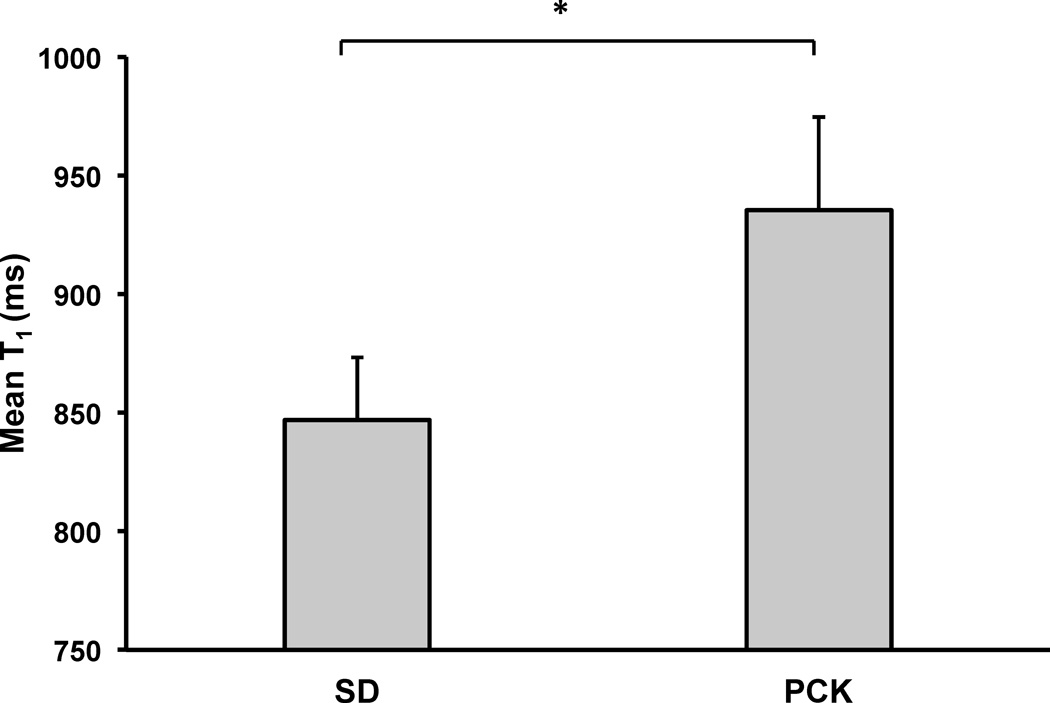
Figure 2.
Plot of mean liver T1 values for SD (n=6) and PCK (n=4) rats at 3 months of age. The mean T1 values for the PCK rats were significantly increased in comparison to the SD rats (*p = 0.01). The respective T1 value for the PCK rat with cholangitis was further increased (n=1, data not shown, mean T1 = 1413 ms).

