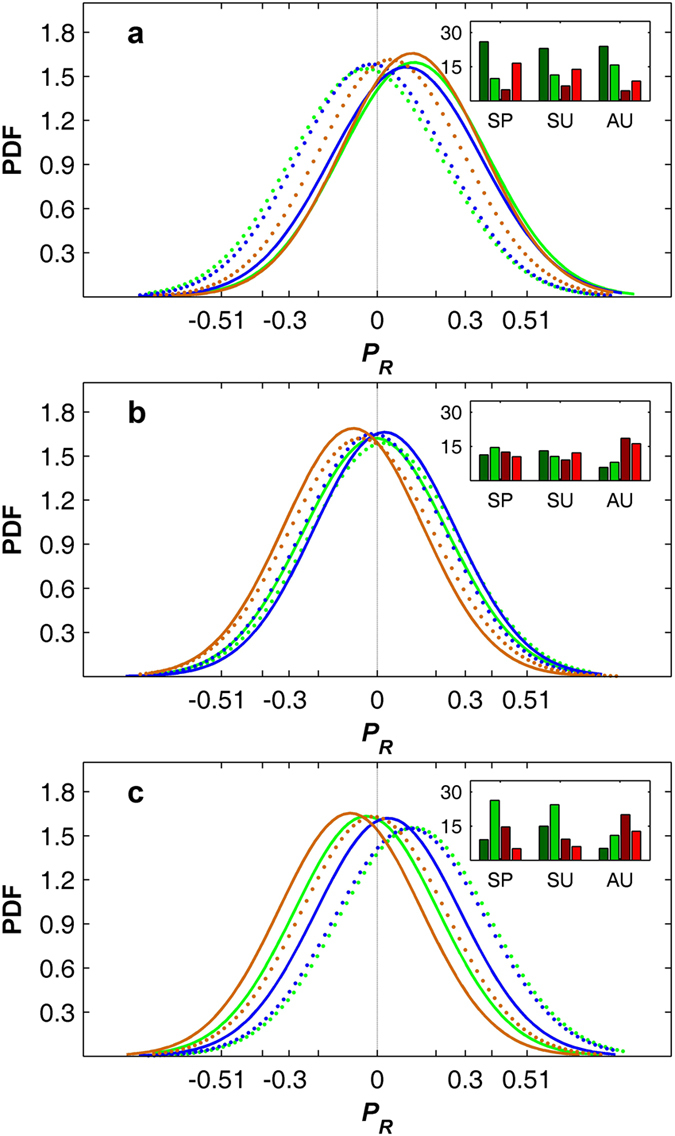
Figure 2. PDFs of the partial correlation coefficients between the mean growing-season (April-October) NDVI and the seasonal VDNC.

PDFs of the partial correlation coefficients (PR) between the mean growing-season NDVI and spring (green lines), summer (blue lines) and autumn (brown lines) maximum temperature (a), minimum temperature (b) and water availability index (c) in temperate (<50 °N, dotted lines) and boreal (≥50 °N, solid lines) regions of the NH. The percentages of the pixels that exhibit significant (p < 0.10) positive (green bars) and negative (red bars) correlations between the mean growing-season NDVI and spring (SP), summer (SU) and autumn (AU) maximum temperature, minimum temperature and WAI in temperate (light color) and boreal (dark color) regions are specified in the insets. The Spearman correlation coefficients R ± 0.51 and ±0.30 in the x axis tick label correspond to the 1% and 10% significance levels of Student’s t-test, respectively.
