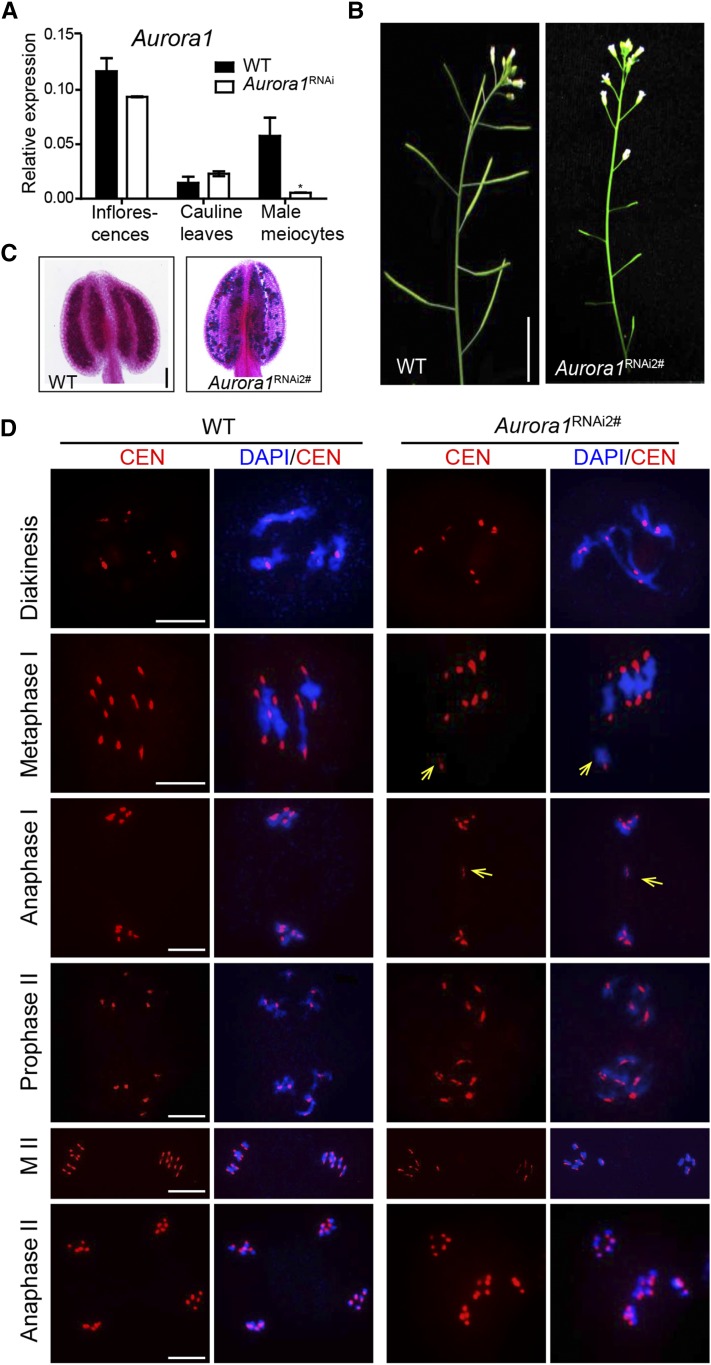
Figure 9.
Phenotypic Analysis of ProDMC1:Aurora1RNAi Plants.
(A) Analysis of expression level of Aurora1 in different tissues of ProDMC1:Aurora1RNAi transgenic plants (Aurora1RNAi) and the wild type (*P < 0.01, Student’s t test).
(B) The short siliques of ProDMC1: Aurora1RNAi plants compared with the wild type indicate reduced fertility. Bars = 5 cm.
(C) Pollen grain viability in wild-type and transgenic anthers as assayed by Alexander staining. Bars = 50 μm.
(D) Chromosome morphology in ProDMC1:Aurora1RNAi meiocytes with misalignment of homologs at metaphase I (yellow arrows) and unequal chromosome segregation at anaphase I (yellow arrow marks lagging DNA) and meiosis II. Bars = 5 μm.

