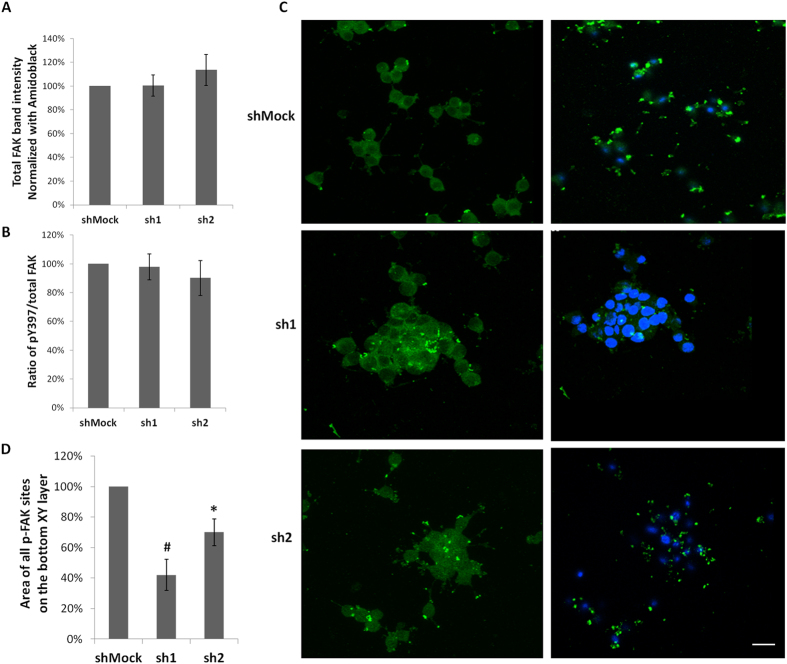
Figure 3. The localization of phospho-FAK was altered by Zbed6 knockdown in βTC6 cells.
(A) Equal numbers of shMock, sh1 and sh2 βTC6 cells were seeded onto mouse laminin (10 μg/ml) coated 24-well plates and incubated for 24 hours. The expression of total FAK was determined by immunoblot and normalized to amidoblack staining of total protein. Results are means ± S.E.M for 6 independent experiments. (B) The phosphorylation of FAK was examined by immunoblot using the phospho-FAK (Y397) antibody. Ratios of pY397/total FAK were quantified and results are means ± S.E.M for 6 independent experiments. (C) Equal numbers of shMock, sh1 and sh2 βTC6 cells were seeded onto mouse laminin (10 μg/ml) coated cover slips and incubated for 24 hours. Cells were stained with a phospho-FAK (Y397) antibody. Images were generated from confocal Z-stack scanning using Imaris Easy 3D model. Left panel: upper XY layer of cells not in direct contact with cover slip. Note the low number of FAK-activation sites in shMock cells, as compared to sh1 or sh2 cells. Right panel: Bottom XY layer of cells close to the cover slip. Note that shMock cells have strong FAK phosphorylation sites whereas sh1 or sh2 cells have weaker and fewer. Results are representative for 3 independent experiments. Scale bar: 20 μm. (D) Area of all phospho-FAK sites on the bottom XY layer was quantified by Image J. The results were normalized to the total cell number in each specific image. Results were summarized from 3 independent experiments. *denotes P < 0.05, #denotes P < 0.01 using Student’s t-test.

