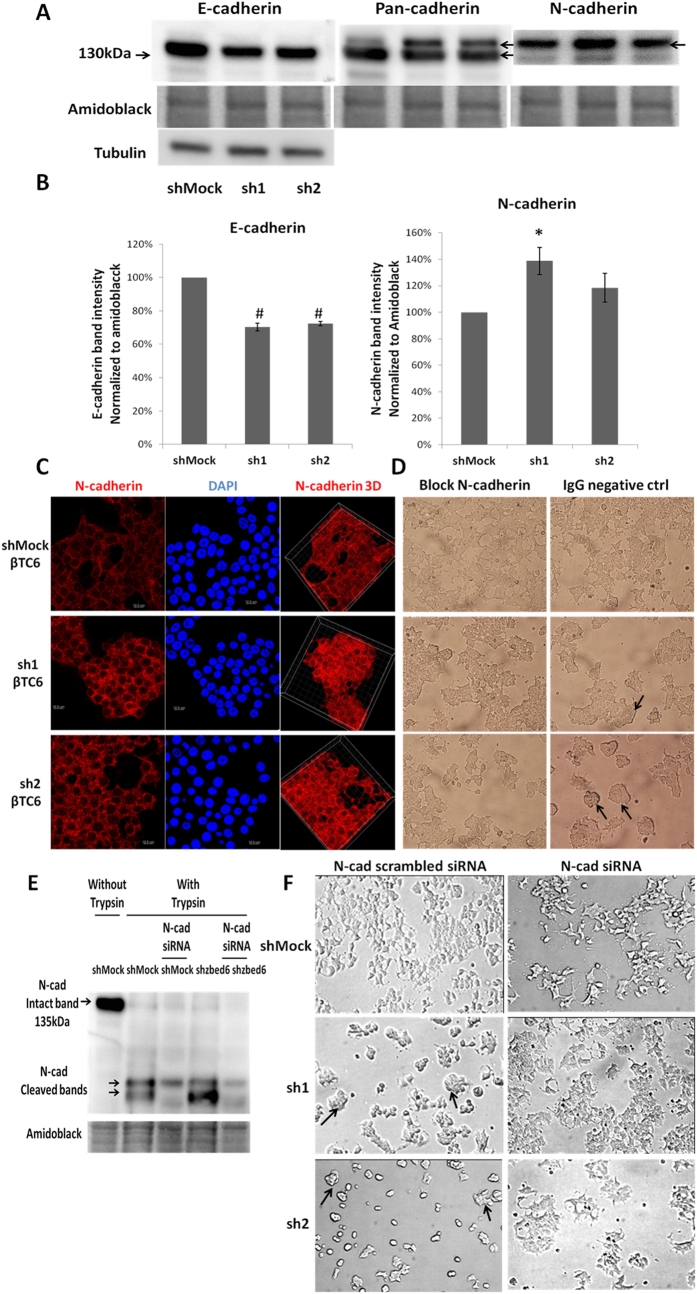
Figure 5. N-cadherin is upregulated in sh1 and sh2 βTC6 cells leading to the formation of three-dimensional cell clusters.
(A) One representative immunoblot image showing the expression of E-cadherin in shMock, sh1 and sh2 βTC6 cells. Amidoblack was used as a loading control. The molecular weight marker is given on the left. The pan-cadherin antibody recognized two bands on the same blot (upper and lower arrow to the right), of which the lower band is E-cadherin and the upper band N-cadherin. (B) Quantification of E and N-cadherin expression in shMock, sh1 and sh2 βTC6 cells. Results are means ± S.E.M for 5 independent experiments. *denotes P < 0.05 and #denotes P < 0.01 using Student’s t-test. (C) Staining of N-cadherin in shMock, sh1 and sh2 βTC6 cells. Equal numbers of cells were seeded onto cover slips without laminin coating and incubated for 3 days. Scale bar: 10 μm. (D) N-cadherin function was blocked by anti-N-cadherin (mouse IgG1 isotype) antibody. After 2 days incubation, cells were photographed with a 20X objective. Arrowheads point to the three-dimensional cell clusters in the IgG negative control group. Results are representative for 3 independent experiments. PiLenti-siRNA-GFP vectors containing 4 different siRNA sequences all targeting to N-cadherin were transfected to ZBED6-silenced βTC-6 and control cells. GFP positive cells were sorted by FACS. (E) The expression of N-cadherin was determined by immunoblot. (Immunoblots were performed directly after trypsinization and sorting therefore the N-cadherin bands were cleaved by trypsin) (F) The morphological changes of the sorted GFP positive cells were photographed after 2 days culture without laminin coating (10x objective). Arrowheads point to the three-dimensional cell clusters in the scrambled siRNA group. Results are representative for 3 independent experiments.

