
Figure 1. ncRNA secondary structure positively correlates with tertiary structure significantly.
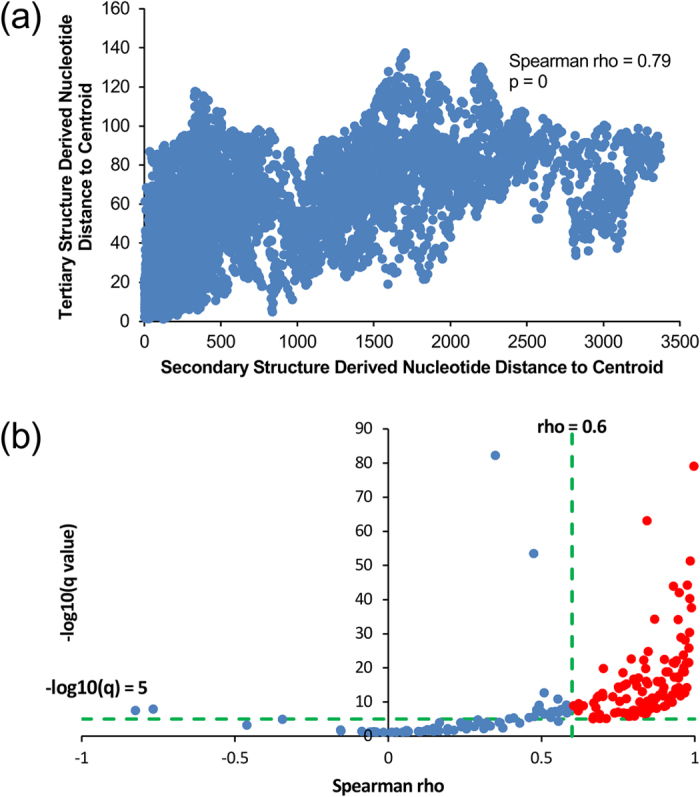
(a) Nucleotide distances to corresponding centroids derived from the tertiary structures plotted versus those derived from the secondary structures of the 203 ncRNAs (Spearman rho = 0.79, p = 0). (b) −log10(q) plotted versus Spearman correlation coefficients of the 203 ncRNAs. Data points of ncRNAs that display significantly strong correlations (Spearman rho >0.6, q < 1e-5) are in red.