
Figure 3. The predicted functional sites of the tRNA (Lys) in a graphical representation.
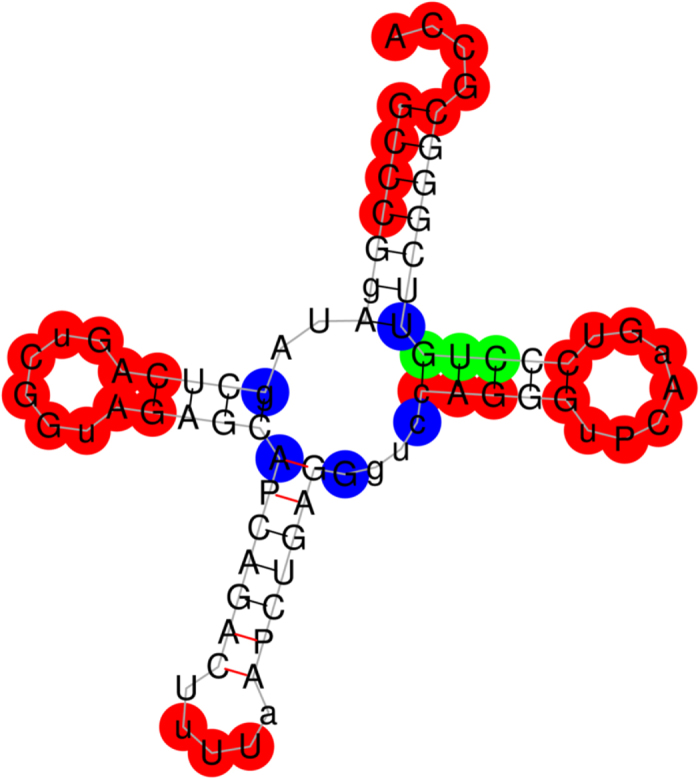
The figure shows the secondary structure of the tRNA (Lys). A predicted functional site is colored red on condition that it hits a known functional site, otherwise blue. And the missed known functional sites are in green color.