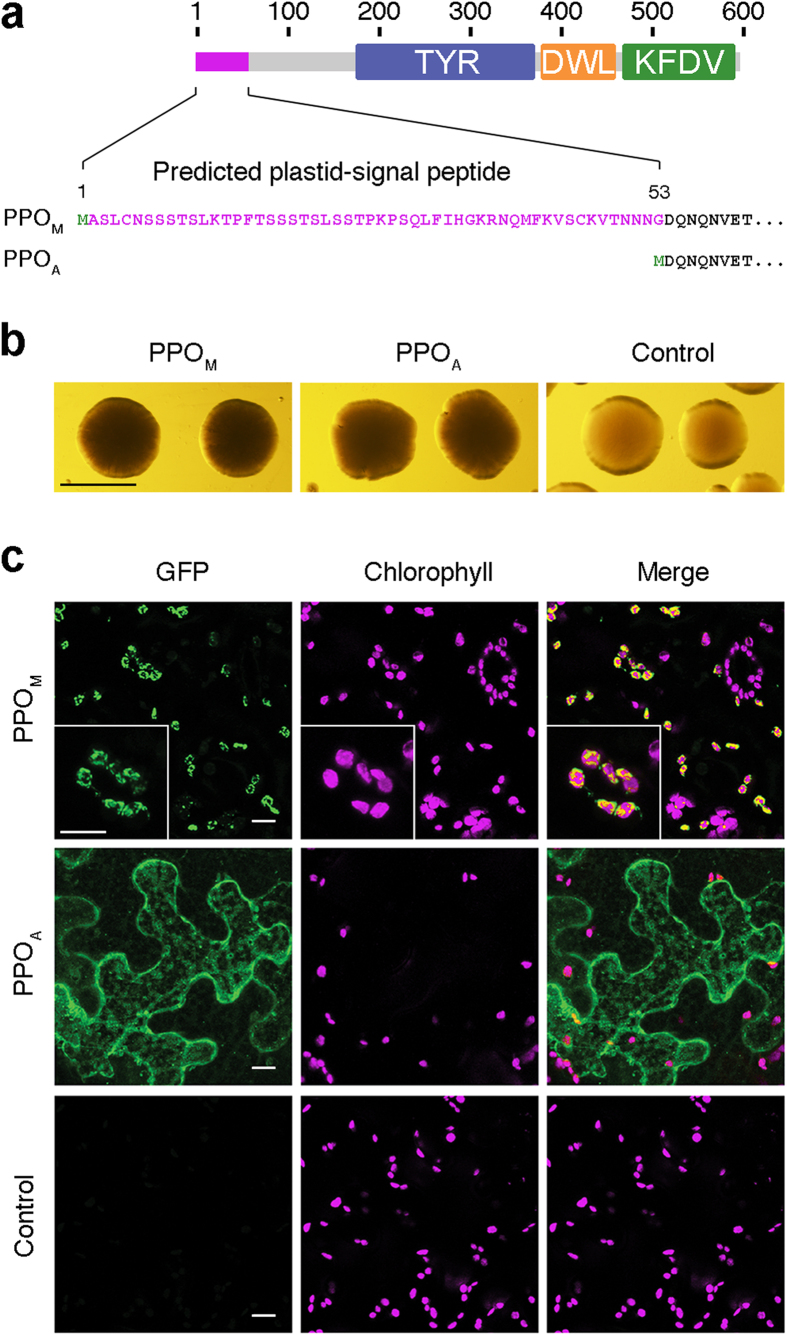
Figure 2. Plastidial (PPOM) and cytosolic (PPOA) PPO models.
(a) Schematic representation of the PPO enzymes used in this study. The 53 amino acids in length predicted plastid signal peptide of PPOM (depicted in magenta) was removed from protein AAA85121 (597 amino acids in length) to generate PPOA. Numbers on top indicate protein (amino acids) length. (b) Melanin production in E. coli cells expressing PPOM and PPOA compared with cells transformed with control plasmid. Images correspond to 3-day-old E. coli colonies grown on LB supplemented with CuSO4, IPTG and chlorogenic acid. Scale bar represents 200 μm. (c) Subcellular localization of PPOM (plastids) and PPOA (cytosol) fused to GFP in N. benthamiana leaves visualized by confocal microscopy. Scale bars represent 10 μm.

