
Figure 4. Phosphocreatine (PCr) and pH timecourse prior to and during exercise in an adult control.
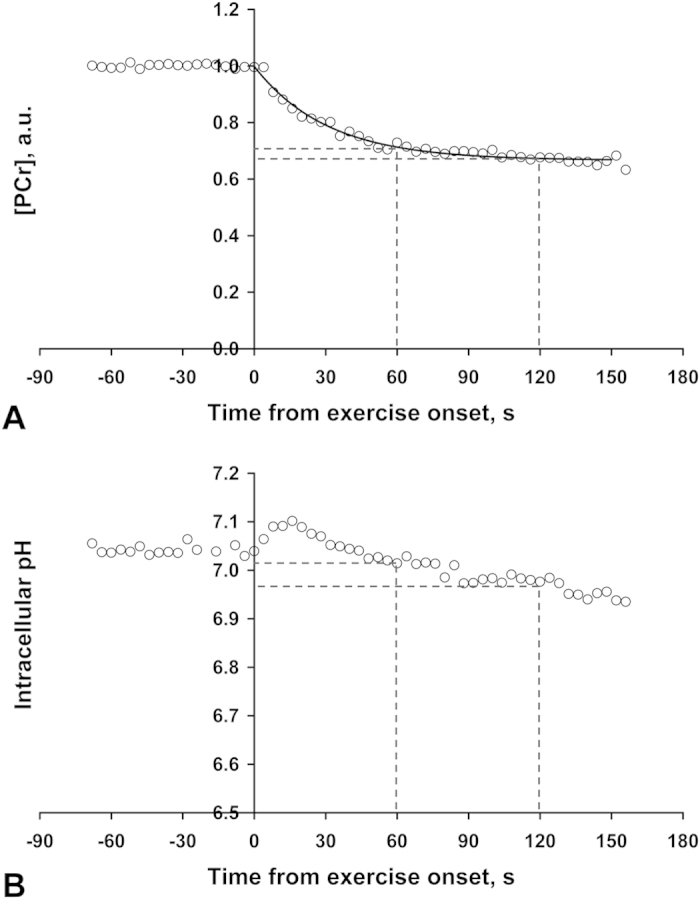
White circles represent [PCr] (A) and intracellular pH (B), as determined from individual spectra of 31P-MRS data with a TR of 4s. Data acquired on a Siemens MAGNETOM 3T Trio (Erlangen, Germany) in a healthy adult volunteer performing exercise as outlined in Methods: Exercise MRS protocol, with a total ankle weight of 2.7 kg. The solid line in (A) represents a mono-exponential fit to the PCr exercise data. Dashed lines aid visualization as to the fractional PCr depletion (A) and intracellular pH (B), after both 1 and 2 minutes of exercise.