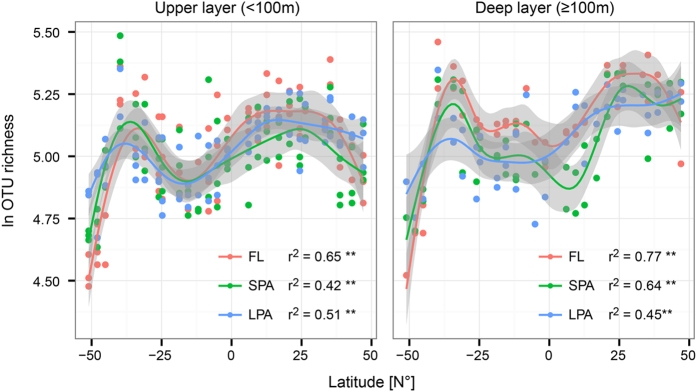
Figure 3. Latitudinal course of bacterial diversity.
The OTU richness (ln S) at each sampling site and depth was plotted against the latitude for the upper (>100 m, left) and lower (>100 m, right) water depths. Generalized Additive Models were fitted with cubic spline. Color code indicates the size fraction of the marine plankton. The coefficient of determination (adjusted R2) and its significance (**p < 0.01) are reported for each model.

