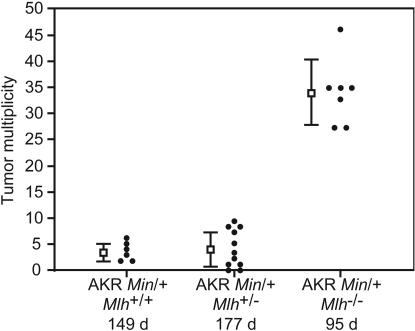
Fig. 1.
Enhancement of tumor multiplicity in AKR Min/+;Mlh1-/- mice. Each dot represents the tumor multiplicity along the entire intestinal tract from a single animal. The square and error bars to the left of each distribution represent the mean ± SD. The tumor multiplicities for the classes are AKR Min/+;Mlh1+/+, 3.7 ± 1.6; AKR Min/+;Mlh1+/-, 4.0 ± 3.5; and AKR Min/+;Mlh1-/-, 34 ± 6.4. The average lifespan is denoted below each genotype.

