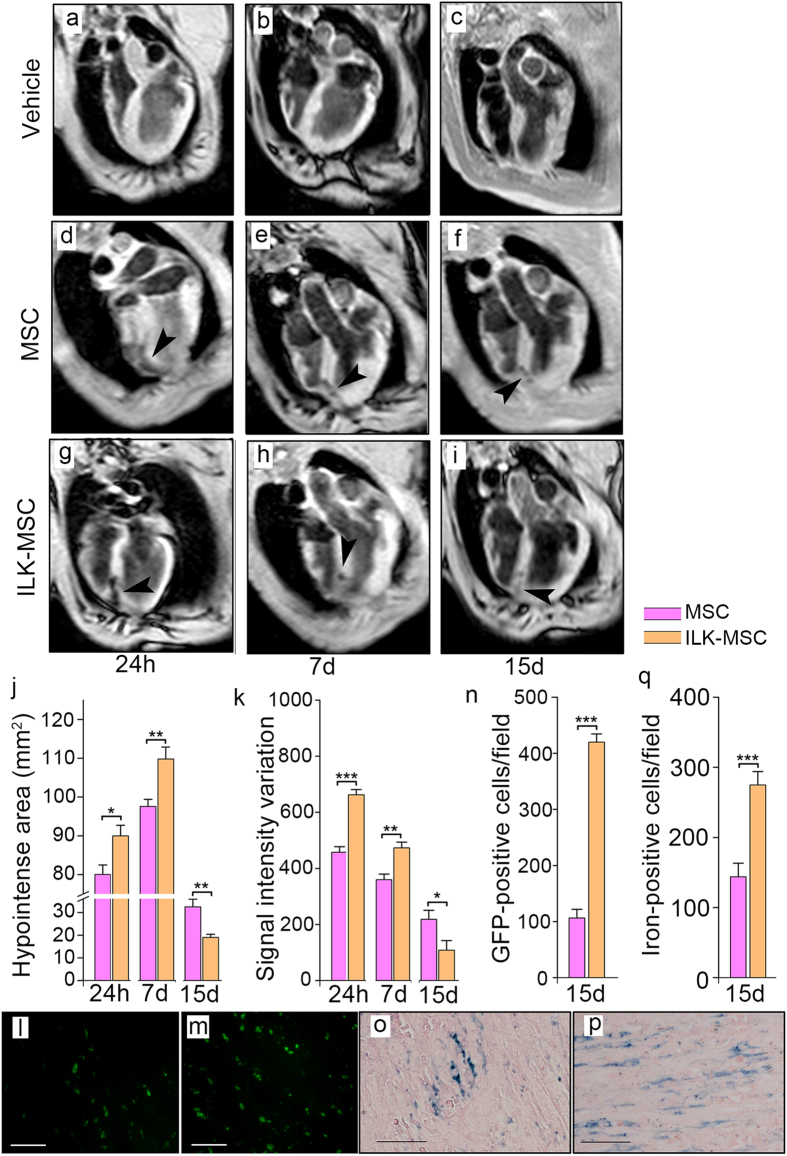
Figure 3. In vivo MRI tracking and histological examination of labeled MSCs after transplantation.
(a–l) Representative T2*-weighted magnetic resonance images of minipig hearts obtained 24 hours, 7 days and 15 days after vehicle control (a–c), vector-MSC (d–f) and ILK-MSC (g–i) transplantation. Black arrow heads indicate hypointense (black) signals associated with iron-labeled MSCs. (j–k) Calculated hypointense area (j) and signal intensity variation (k) corresponding to the magnetic resonance slices in (d–i). (l– n) Fluorescence microscopy of green fluorescence signal of iron–labeled cells in peri-infarct areas at 15-day follow-up. (o–q) Prussian-blue staining of iron-labeled cells in peri-infarct areas at 15-day follow-up, showing that more cells were iron-labeled but iron content per cell was lower in ILK-MSC group than vector-MSC group. Data are mean ± SEM. *P < 0.05, **P < 0.01, ***P < 0.001 between comparisons indicated by bracket. Scale bars, 10 μm.

