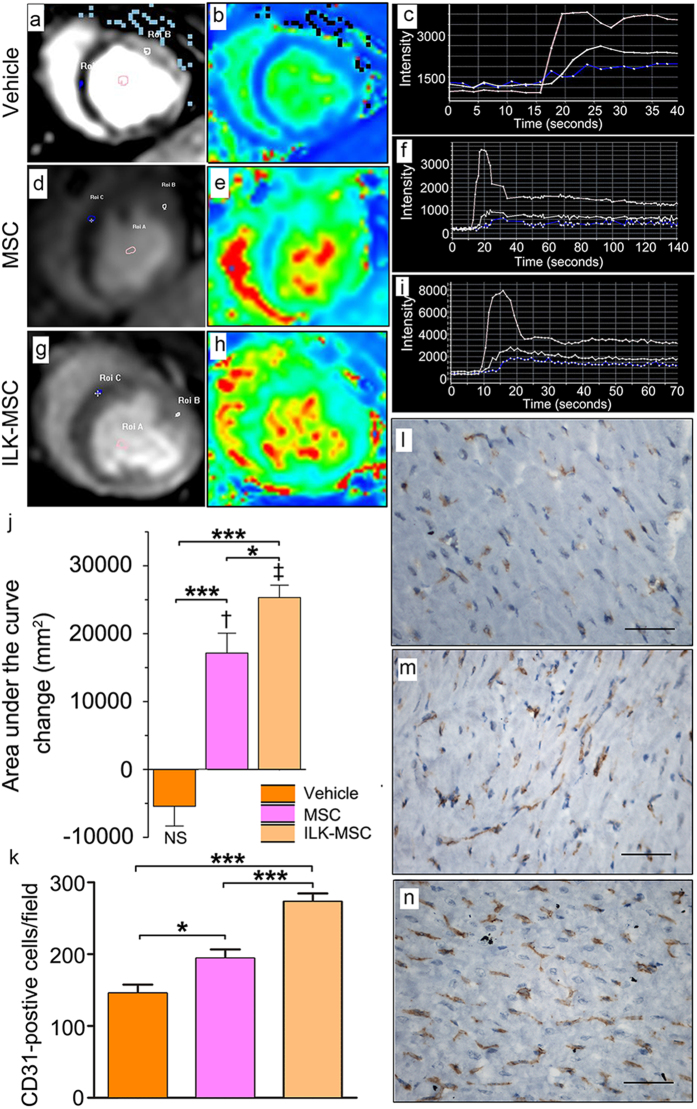
Figure 6. Regional myocardial perfusion recovery following ILK-MSC transplantation.
(a–j) Representative contrast-enhanced first-pass perfusion images (a,d,g) and pseudocolor magnetic resonance images (b,e,h) at 15-day follow-up, along with respective time–signal intensity curves (c,f,i) from which areas under the curve were calculated (j) reflecting blood supply in certain region in one vehicle- (a–c), one vector-MSC- (d–f) and one ILK-MSC-treated (g–i) minipig. Three curves in c indicated blood pool, normal myocardium and infarcted myocardium respectively from top to bottom, as were curves in f and i. Area under the curve changes from baseline to 15 days post-transplantation were calculated, showing significant improvement of regional blood supply in ILK-MSC treated and vector-MSC treated animals, and a substantial difference between these two MSC groups. (k–n) Immunohistochemistry staining of CD31 in peri-infarct zones of three groups confirmed an enhanced microvessel density in ILK-MSC treated animals. Data are mean ± SEM. †P < 0.01, ‡P < 0.001 versus baseline; *P < 0.05, ***P < 0.001 between comparisons indicated by bracket. Scale bars in (l–n), 10 μm.

