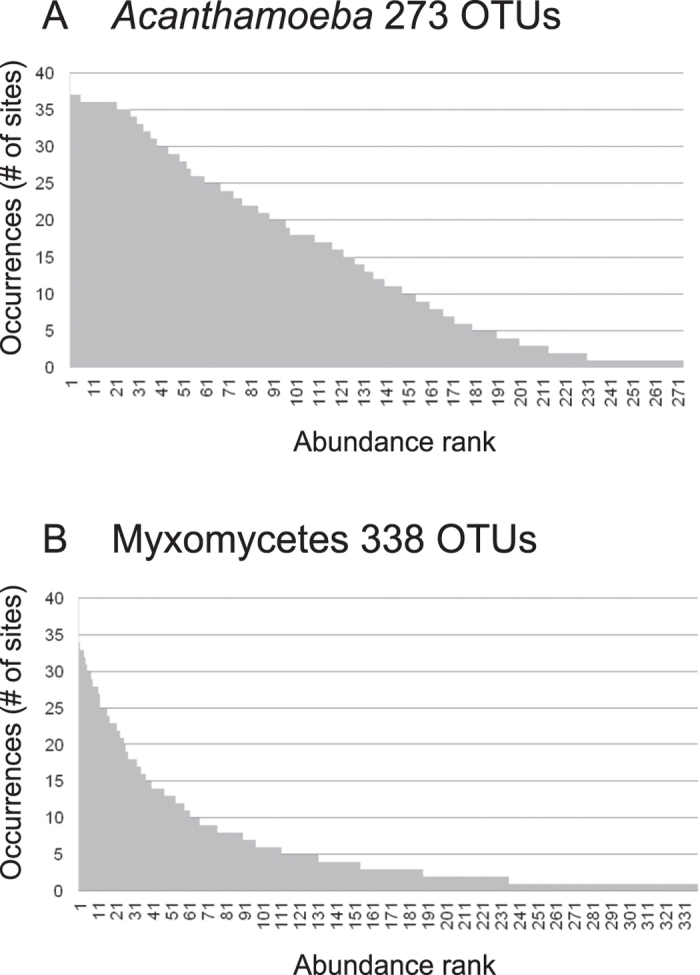
Figure 3. Rank abundance histogram of the OTUs.

(A) In Acanthamoeba, OTUs abundance decreases regularly, showing few rare OTUs. (B) In Myxomycetes, few OTUs are abundant and many are rare.

(A) In Acanthamoeba, OTUs abundance decreases regularly, showing few rare OTUs. (B) In Myxomycetes, few OTUs are abundant and many are rare.