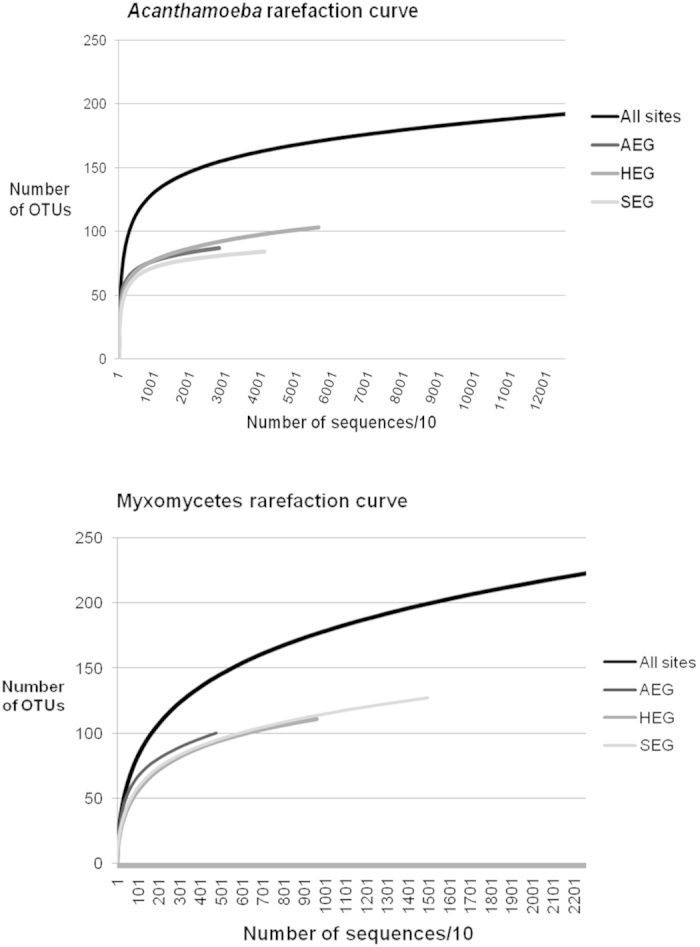
Figure 4. Rarefaction curves calculated for the entire dataset (All sites) and for each region (AEG, HEG and SEG).

The number of OTUs in all regions together is smaller than the total number of OTUs, because some are shared between regions.

The number of OTUs in all regions together is smaller than the total number of OTUs, because some are shared between regions.