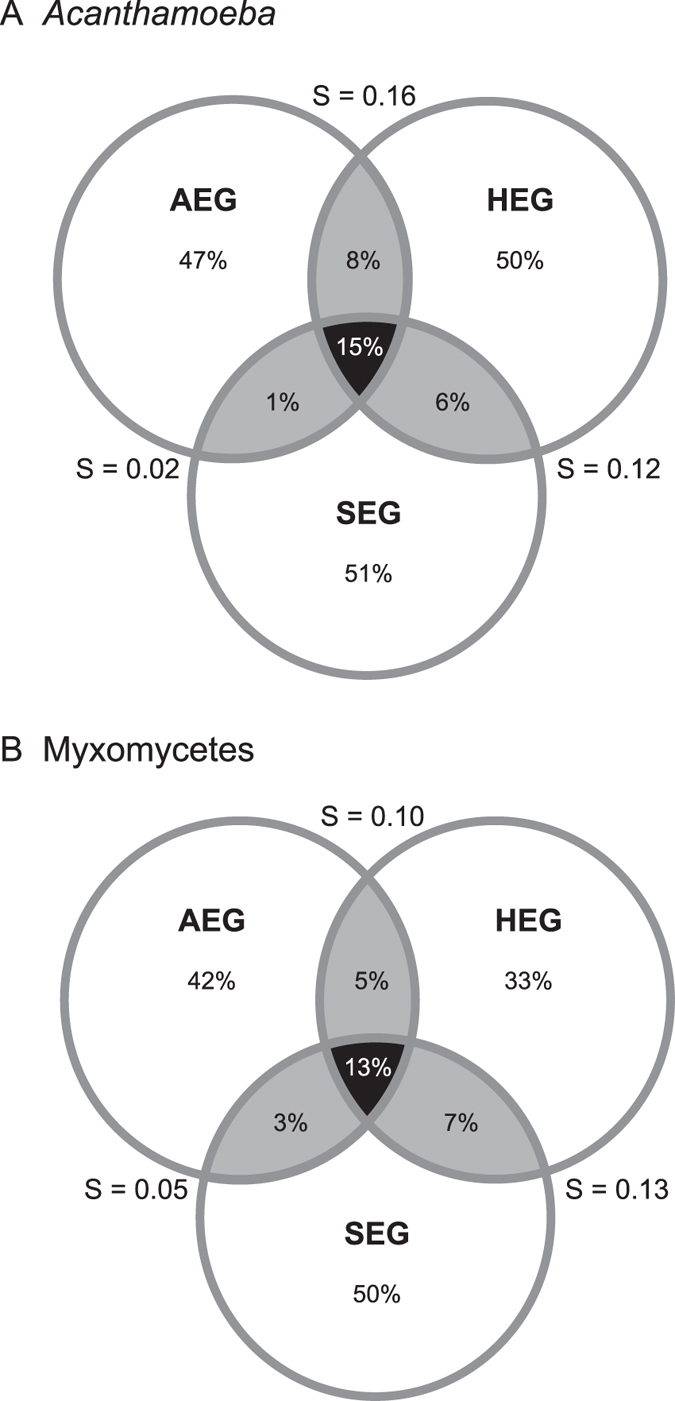
Figure 6. Inter-region similarity: Percentages of unique OTUs per region (in the circles) and shared between regions (in the intersections).

Shaded in black, OTUs shared by the three regions (as percentage of the sum of the three regions); shaded in grey, OTUs shared between two regions (percentage of the sum of the two regions). S, Sørensen similarity index between two regions. (A) Acanthamoeba, total richness = 192. (B) Myxomycetes, total richness = 223.
