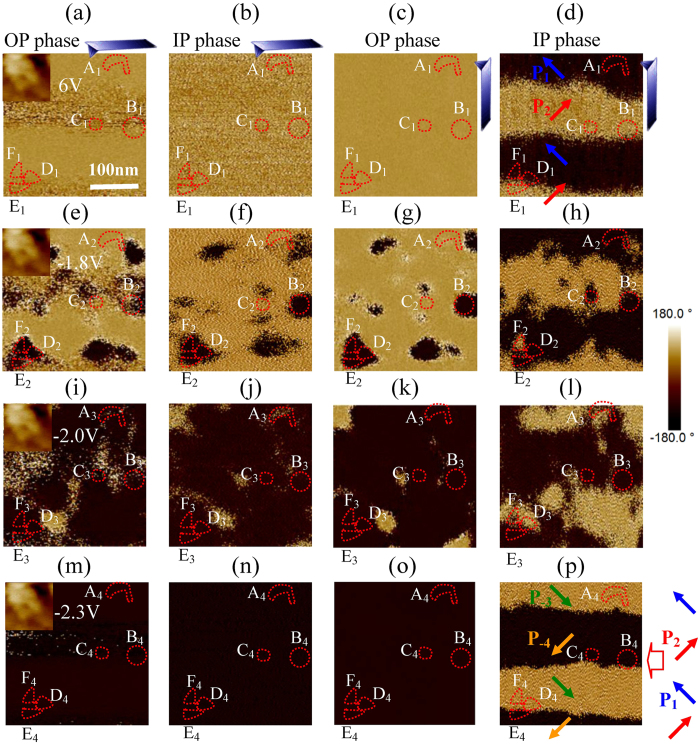
Figure 2. The electrical switching of ferroelectric polarization.
The OP and IP phase images of the 6 V polarized area observed by a PFM tip with (a,b) 0o and (c,d) 90o rotations, and these phase images of the same area after it was polarized by (e–h) −1.8 V, (i–l) −2 V and (m–p) −2.3 V, where the inset is surface morphology and six independent regions are marked with A,B,C,D,E and F.

