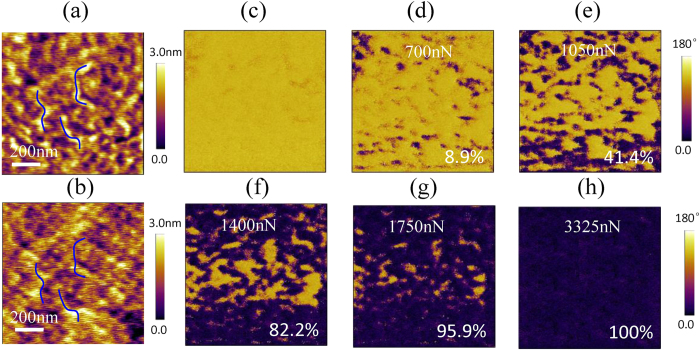
Figure 3. The mechanical switching of ferroelectric polarization.
The surface morphology (a) before and (b) after it was scanned by the PFM tip with 3325 nN mechanical force. The OP phases image of the same region after it was scanned by the PFM tip with a force of (c) 140 nN, (d) 700 nN, (e) 1050 nN, (f ) 1400 nN, (g) 1750 nN and (h) 3325 nN, where the percent is the ratio of area with downward polarization.

