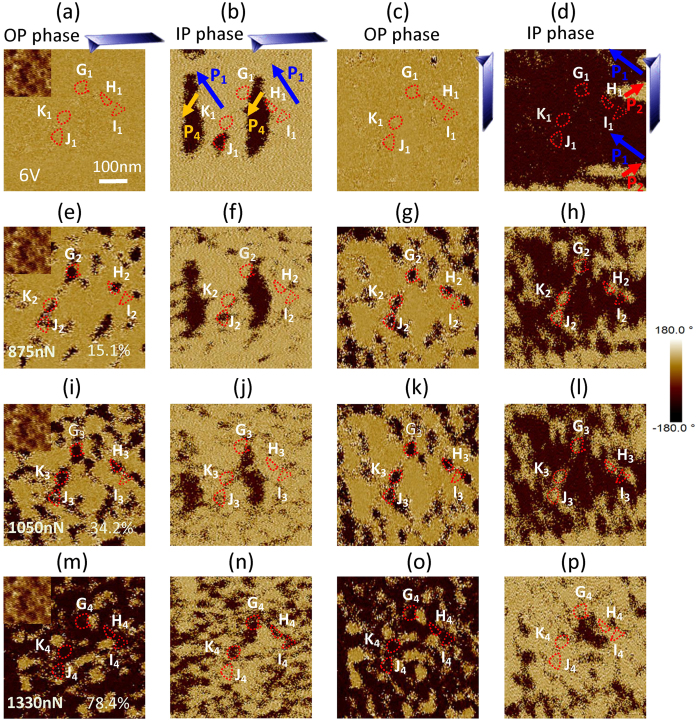
Figure 4. The mechanical switching of ferroelectric polarization.
The OP and IP phase images of the 6 V polarized area observed by a PFM tip with (a,b) 0o and (c,d) 90o rotations, and the images of the same area after it was polarized by a mechanical force of (e–h) 875 nN, (i–l) 1050 nN, (m–p) 1330 nN, where the inset is the surface morphology, the five independent regions are marked with G,H,I,J and K, and the percent is the ratio of area with downward polarization.

