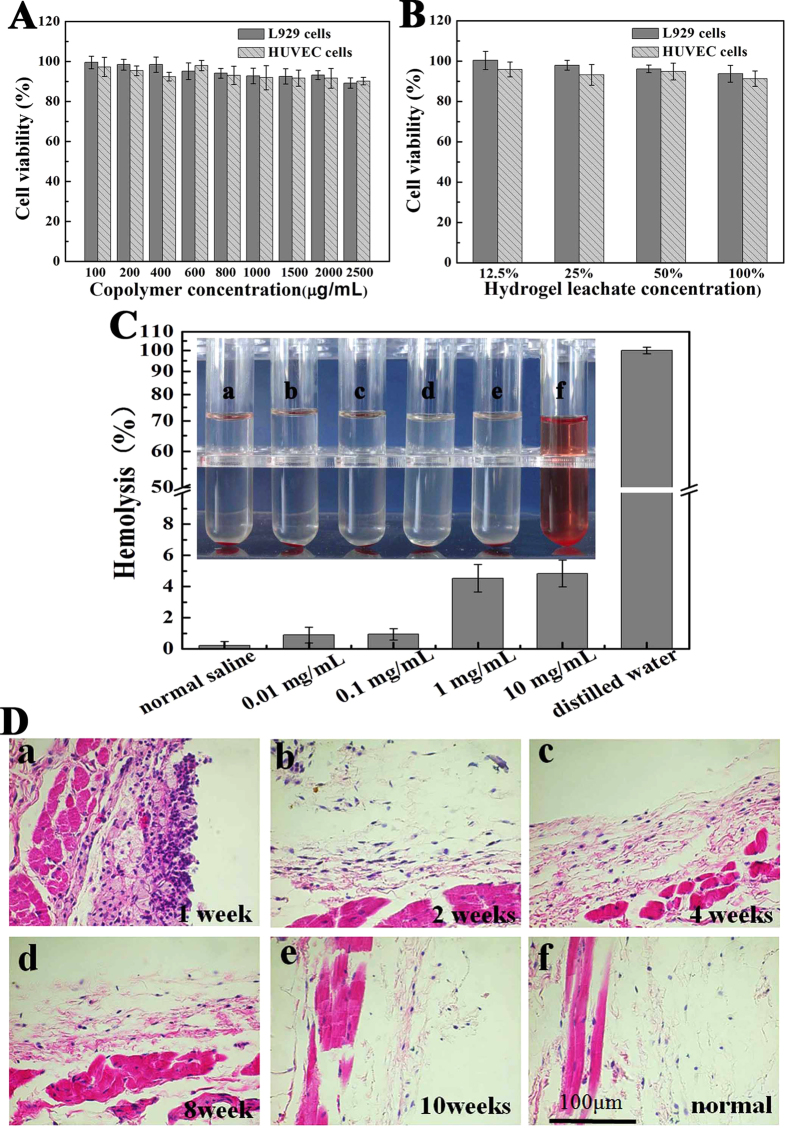
Figure 4. Biocompatibility of PDLLA-PEG-PDLLA hydrogel (S3, 25 wt%) in vitro and in vivo.
(A,B) Effect of the copolymer and hydrogel extract on cell viability of L929 and HUVEC cells measured by MTT assay. Data were presented as mean ± SD (n = 5). (C) Hemolytic test of PDLLA-PEG-PDLLA triblock copolymer (S3). This photo was taken after 3 hours’ reaction. Sample (f) was distilled water used as positive control, while sample (a) was normal saline used as negative control. The concentration of PDLLA-PEG-PDLLA copolymer was 0.01 mg/ml (b), 0.1 mg/ml (c) 1.0 mg/ml (d), and10.0 mg/ml (e). Hemolysis rate in each group were presented as mean ± SD (n = 3). (D) HE-staining of surrounding tissues at designated time (a to e) after dorsal subcutaneous injection of PDLLA-PEG-PDLLA solution (S3, 25 wt% in PBS, PH = 7.4) into BALB/c mice for examination of the inflammatory response. The normal tissue taken as the blank control was shown in (f). Magnification: 400 ×. The images was representative of n = 3.

