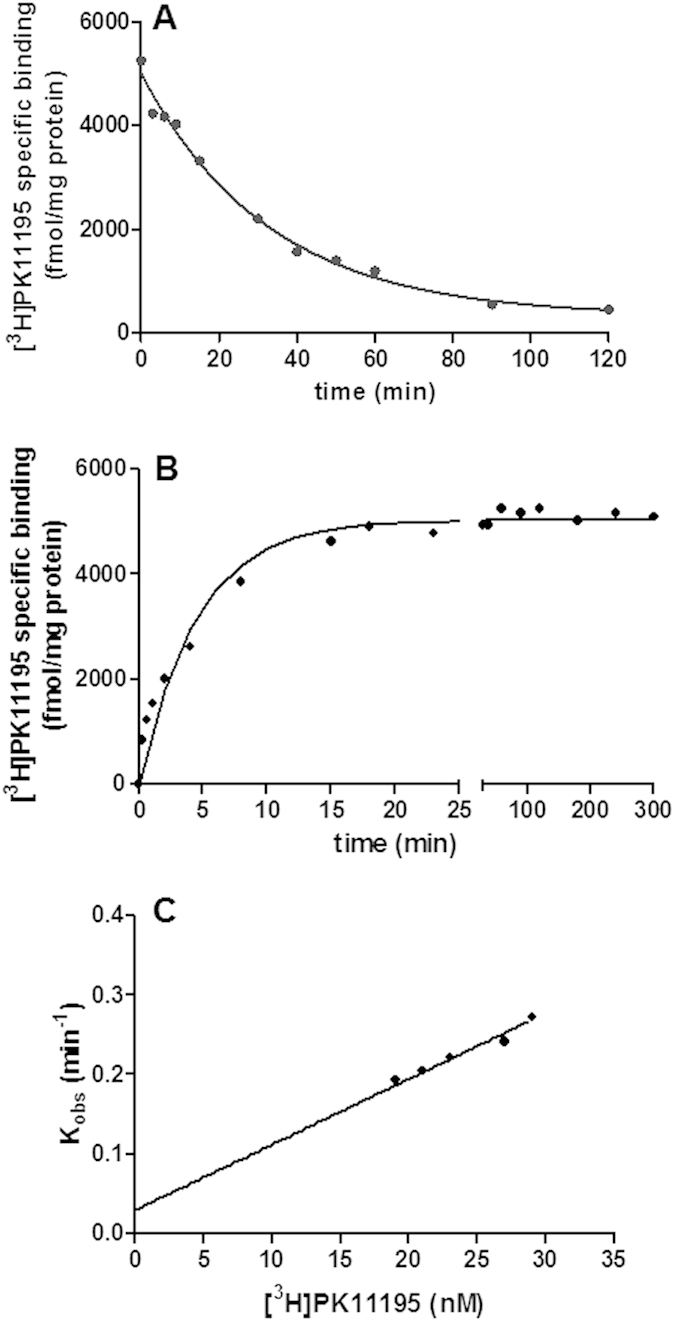
Figure 1. [3H]PK11195 kon and koff by ‘traditional’ dissociation and association kinetics assays.

(A) [3H]PK11195 binding dissociation Kinetics: Data were best fitted using a one-phase exponential decay function to produce a t1/2 estimate. This was converted into a koff value by using Equation 1, as detailed in the Materials and Methods section. The ordinate reports the specific [3H]PK11195 binding expressed as fmol/mg of protein. The abscissa reports the incubation time expressed in min. (B,C) [3H]PK11195 binding association Kinetics: a family of association kinetics curves were constructed incubating membrane homogenates with a range of [3H]PK11195 concentrations as described in the Materials and Methods section. Data were fitted using a one phase exponential association function to yield a kob. (B) A representative association curve performed using 23 nM [3H]PK11195 up to 5 h incubation time is showed. The ordinate reports the specific [3H]PK11195 binding expressed as fmol/mg of protein. The abscissa reports the incubation time expressed in min. (C) kobs values plotted against the corresponding [3H]PK11195 concentration employed are showed.
