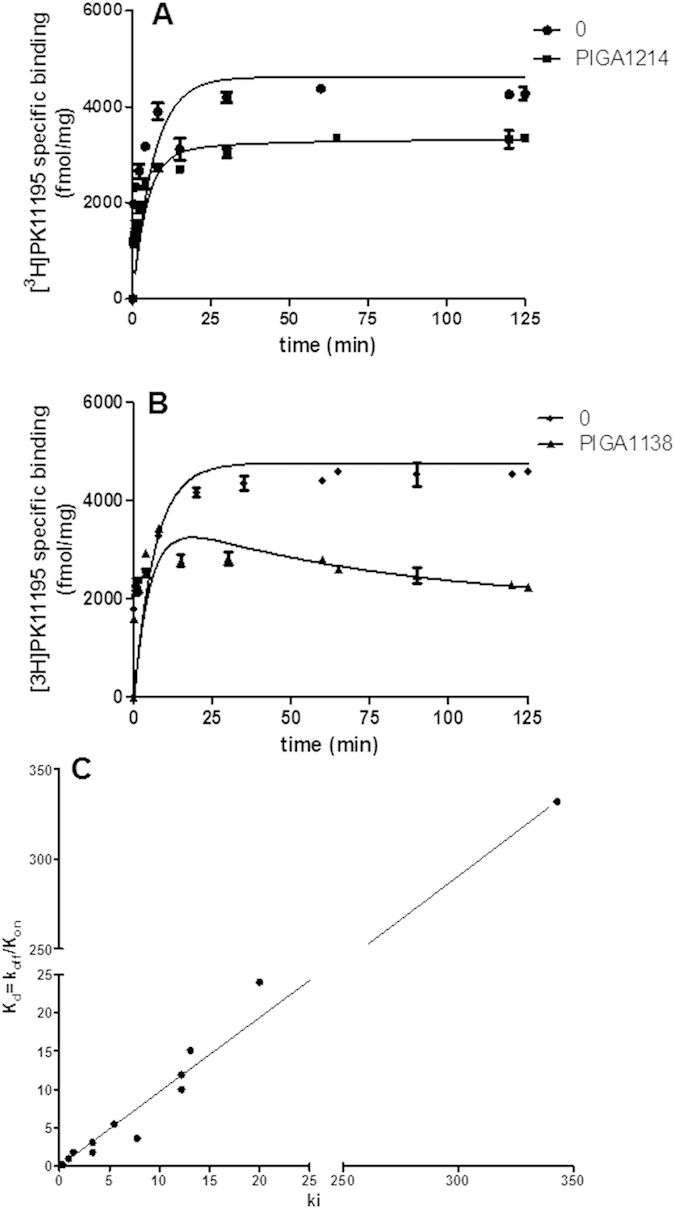
Figure 3. Competitive association kinetics assays of TSPO ligands and correlation between Ki and ‘Kinetic Kd’ values.

(A) Representative curves obtained using three-fold Ki of PIGA1214 (B) or PIGA1138. (C) Ki values were obtained from [3H]PK11195 competition binding experiments at equilibrium. The kinetically Kd values were derived from the competition association experiments.
