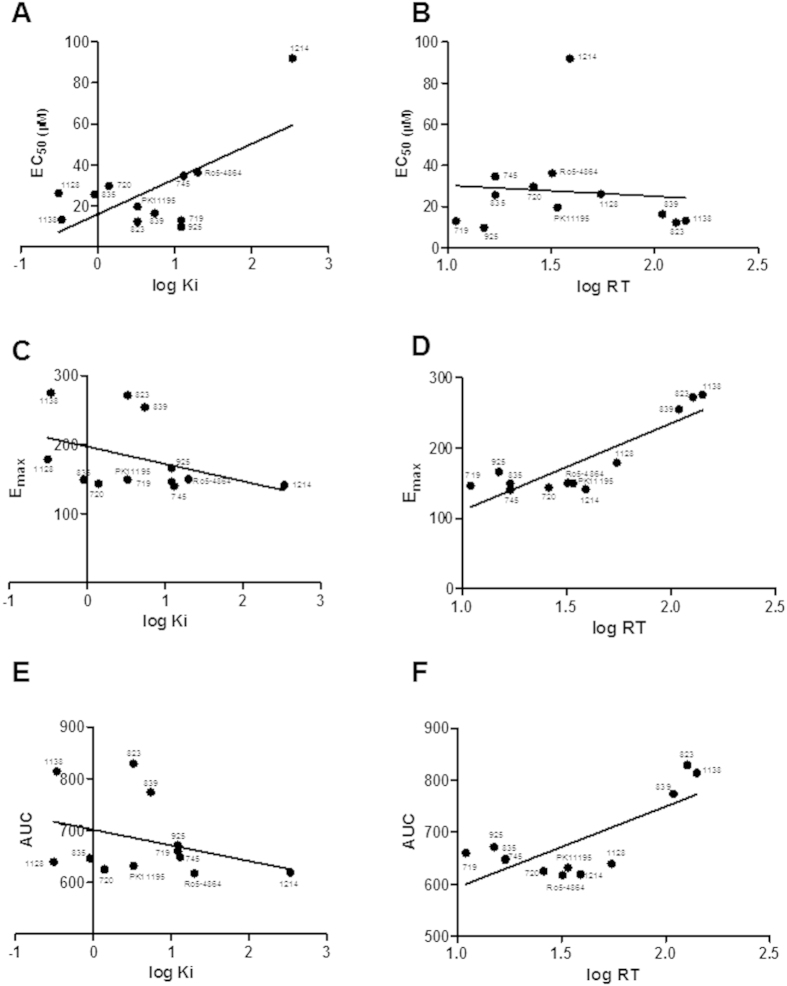
Figure 5. Correlation analyses between kinetic/thermodynamic and steroidogenic parameters.
TSPO compound names were included next to their respective data points (for PIGA compounds only the ID numbers were shown). (A) Scatter plot of the EC50 values against thermodynamic parameters (logKi) of test TSPO ligands; (B) Scatter plot of the EC50 values against kinetic parameters (logRT) of test TSPO ligands; (C) Scatter plot of the Emax values against thermodynamic parameters (logKi) of test TSPO ligands; (D) Scatter plot of the Emax values against kinetic parameters (logRT) of test TSPO ligands; (E) Scatter plot of the AUC values against thermodynamic parameters (logKi) of test TSPO ligands; (F) Scatter plot of the AUC values against kinetic parameters (logRT) of test TSPO ligands.

