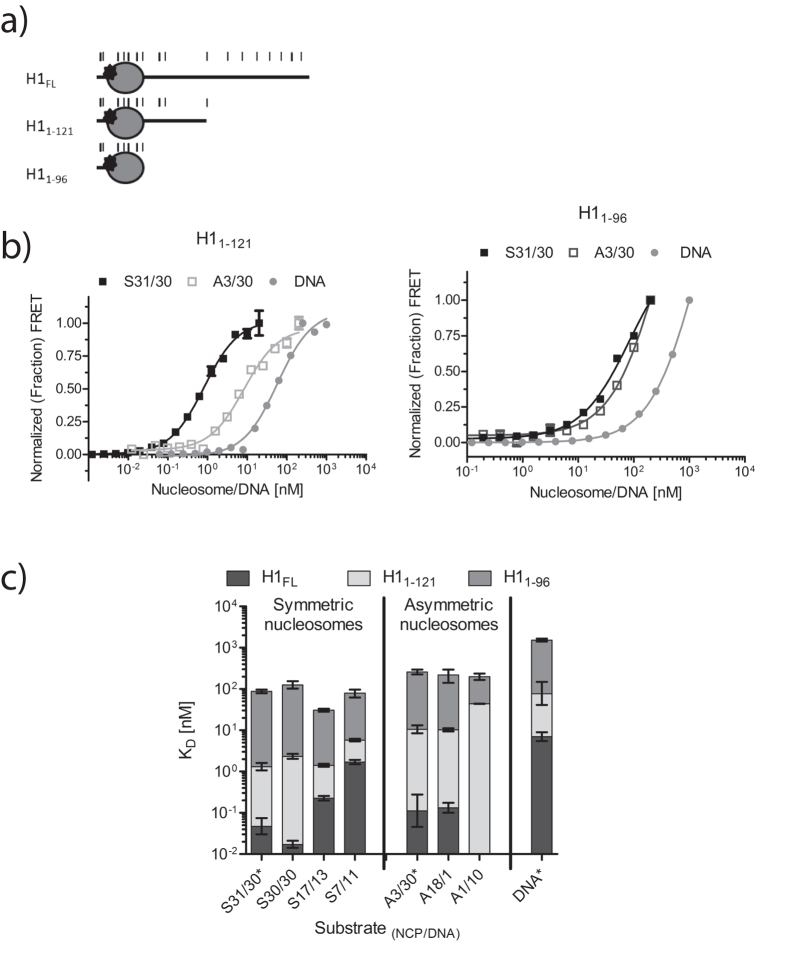
Figure 5. C-terminal tail of H1 contributes mostly to linker DNA binding.
(a) H1 constructs used; *indicates Oregon Green label at S18C. Five lysine residues are indicated by each thin black line. Each thick black line represents one arginine residue. (b) Representative FRET binding curves for H11–121 (left) and H11–96 (right). H1 (donor) was kept at constant concentration of 0.5 nM (5 nM with 30 bp linear DNA) and labeled nucleosome (acceptor) was titrated (0–20 nM: 0–200 for 30 bp linear DNA respectively). Binding isotherms are shown for S31/30, A3/30, and 30 bp DNA. Kd values and errors are listed in Table 1. (c) Bar graph on logarithmic scale of the average of each replicate Kd with 95% confidence interval for each nucleosome or free DNA in this study bound with H1FL (dark gray), H11–121 (light gray), or H11–96 (medium gray). Corresponding binding curves are shown in Figs 1b, 2a and 5b and Supplementary Figure 3a,b.

