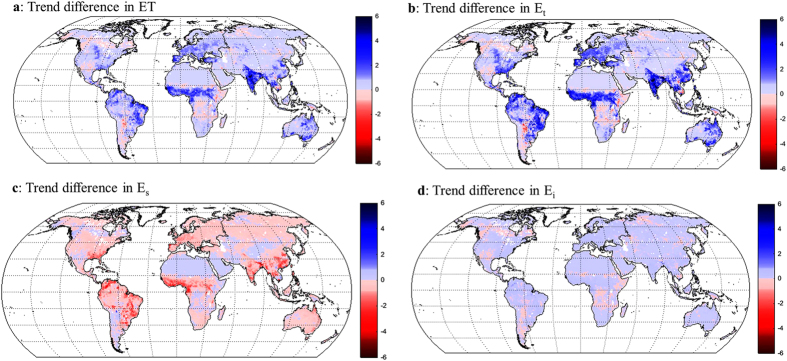
Figure 6. Global maps of trend difference.
(a) ET (mm year−2). (b) Et (mm year−2). (c) Es (mm year−2). (d) Ei (mm year−2). Using the PML model, the trend difference is calculated between the average estimates using the observed LAI time series (experiments 1 and 2) minus the average estimates using detrended LAI time series (experiments 3 and 4); details of these experiments are provided in the Methods section. The maps were generated using MATLAB.

