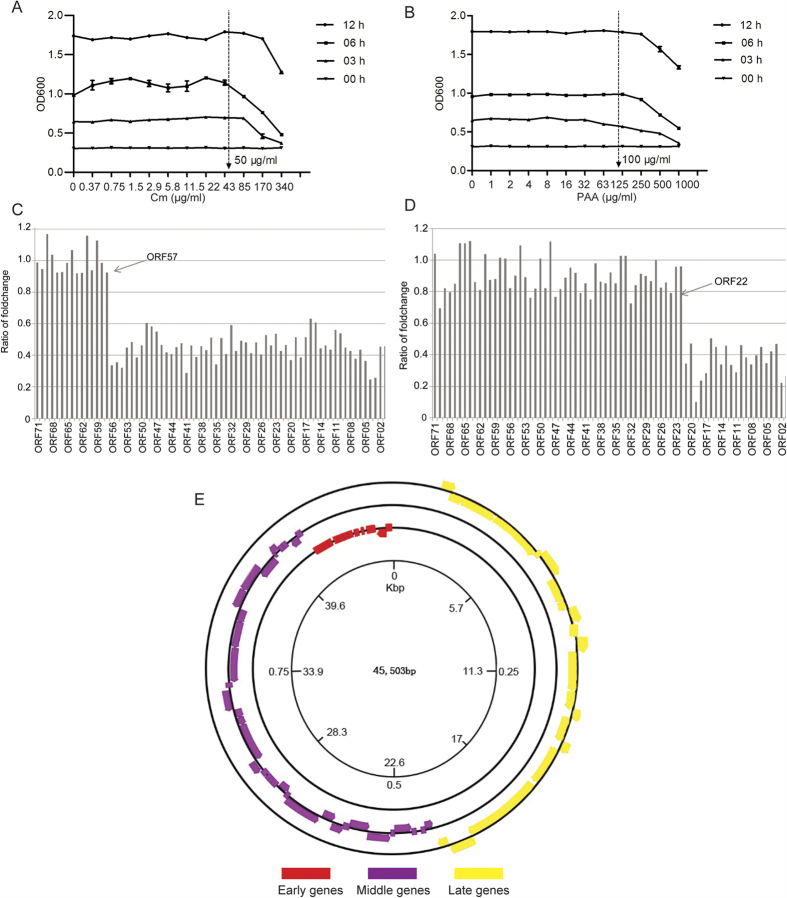
Figure 3. Validation for the temporal kinetic classes of PaP3 genes.
(A,B) Drug inhibitor resistance experiment. The arrows indicate the optimum drug concentrations (50 μg/ml Cm or 100 μg/ml PAA) that did not affect the growth of the host bacteria and were used to verify the classification of PaP3 ORFs. (C,D) Expression patterns of PaP3 ORFs after treatment of Cm for 30 min and PAA for 80 min. (E) Cycle map of PaP3 expression transcriptional initiation was from the 5′ end of antisense strand and the early, middle were orderly expressed. The late genes were transcribed in initiation from 5′ end of sense strand.

