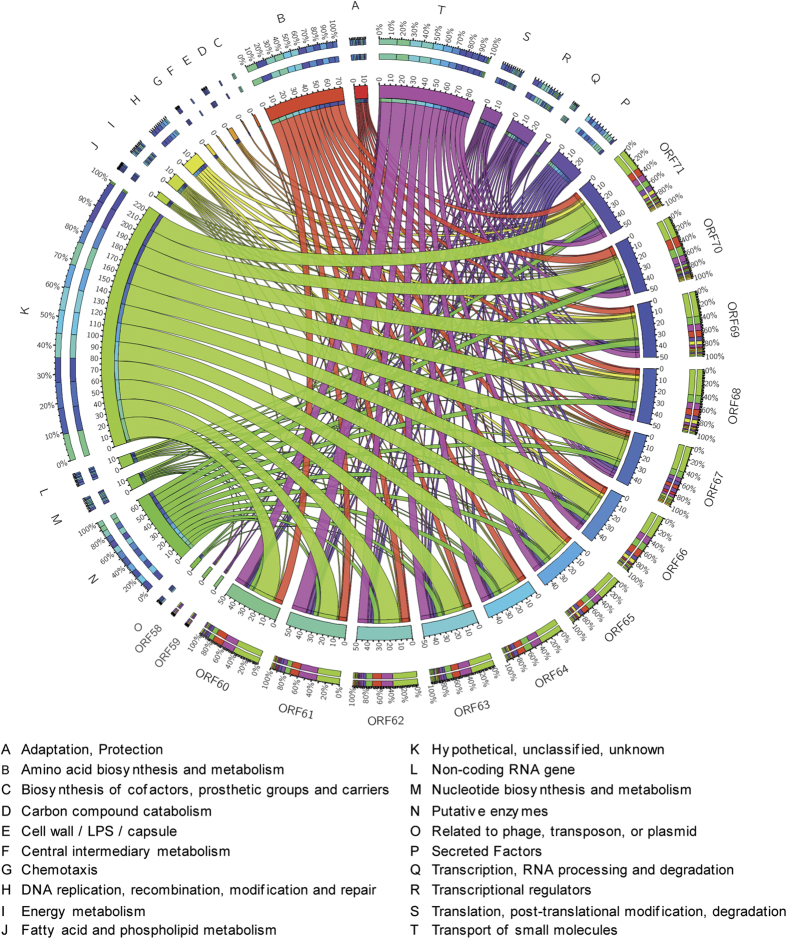
Figure 7. Merged gene co-expressed network between phage and host.
The circos plot was constructed by integrating gene co-expression network from all the time points, which consisted of 20 PseudoCAP functions of host and 14 ORFs of PaP3. The number of host target genes of each phage gene in each PseudoCAP function term was calculated to show the biological functions of host linked with phage genes. The PseudoCAP functions were shown with different color and the number of host genes in each functional term was indicated with different size of link. Wider links meant the more host genes in a PseudoCAP function term. The structure of the color box for phage genes (the outer-most ring) indicated the functional composition of their host gene partners.

