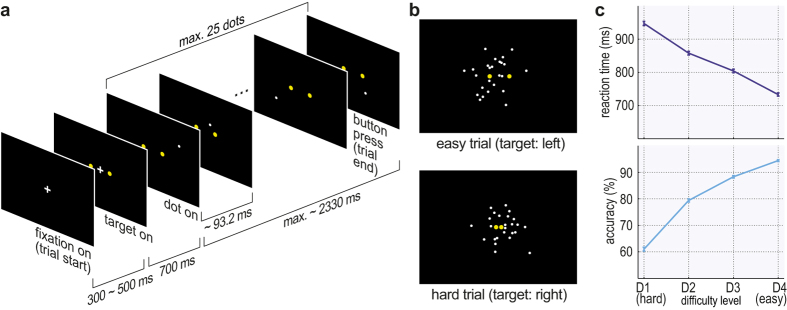
Figure 1. Experimental design and behavioural data on group level.
(a) The fixation cross is shown for a duration jittered between 300 and 500 ms, followed by the onset of two target dots (yellow) for 700 ms. After that, a single white dot starts to show, so that the participant observes a single white dot relative to two yellow targets. The position of the white dot changes every 93 ms. A trial ends when the participant makes a decision or when a maximum of 25 dots (~2330 ms) has been shown. The task is to decide fast and accurately around which of the targets the dot is moving. (b) Illustration of stimulus shown to participants summarised over time: The positions of the two yellow dots (targets) is fixed for one trial. The white dots are superimposed for all frames, to depict the variance of the dot trajectory. In the experiment, participants see each dot as a single frame, consecutively. The distance between the targets determines the difficulty of a trial, as the dot positions are drawn from a Gaussian with the correct target position as mean. (c) Reaction time and accuracy (as percentage of correct trials) averaged over all participants for four difficulty levels (D1–D4). Error bars are standard error (SE) over all participants, all non-timed-out trials.

